CG Homework 6, due Mon 2017-10-30 2359 Solution

  1. (4 pts) Use the homogeneous matrix to project homogeneous points onto the plane x+3y+2z=4, with COP at the origin. What does the point (1,2,4,5) project to? Give the answer as a Cartesian point.

    From https://wrf.ecse.rpi.edu/pmwiki/pmwiki.php/Main/HomogeneousCoords :

    Normalize the plane equation to \(x/4 + 3/4 y + 1/2 z = 1\)

    The matrix and point vector are \(\begin{pmatrix} 1& 0& 0& 0\\ 0& 1& 0& 0\\ 0& 0& 1& 0\\ 1/4 & 3/4 & 1/2 & 0 \end{pmatrix} \begin{pmatrix} 1 \\ 2 \\ 4 \\ 5 \end{pmatrix}\)

    Multiply to get \(\begin{pmatrix} 1 \\ 2 \\ 4\\ 15/4 \end{pmatrix}\).

    Converted to Cartesian gives \(\begin{pmatrix} 4/15 \\ 8/15 \\ 16/15 \end{pmatrix}\).

    You can check that this is on the plane.

  2. (4 pts) Repeat the previous question with the COP changed to (1,1,1,1).

    The easiest way might be to translate (1,2,4,5) by -(1,1,1,1), project onto the translated plane, then translate the result back.

    1. Homo (1,2,4,5) is Cart (1/5, 2/5, 4/5).
    2. The Cart COP is (1,1,1). We will translate everything by (-1,-1,-1).
    3. (1/5, 2/5, 4/5) translates to (-4/5, -3/5, -1/5).
    4. The plane equation is changed by replacing x by x+1, y by y+1, z by z+1. (Think about it.)
    5. x+3y+2z=4 becomes x+3y+2z = -2 becomes -x/2 - 3/2 y - z =1.
    6. Now multiply \(\begin{pmatrix} 1& 0& 0& 0\\ 0& 1& 0& 0\\ 0& 0& 1& 0\\ -1/2 & -3/2 & -1 & 0 \end{pmatrix} \begin{pmatrix} -4 \\ -3 \\ -1 \\ 5 \end{pmatrix}\)
    7. That gives Homo (-4, -3, -1, 15/2) or Cart (-8/15, -6/15, -2/15).
    8. Translate it back by (1,1,1).
    9. The answer is (7/15, 9/15, 13/15).
  3. (6 pts) Do exercise 5.6 on page 272 of the text.

    This is harder than I expected, and so everyone will get full points.

  4. (6 pts) This question will take some thinking).

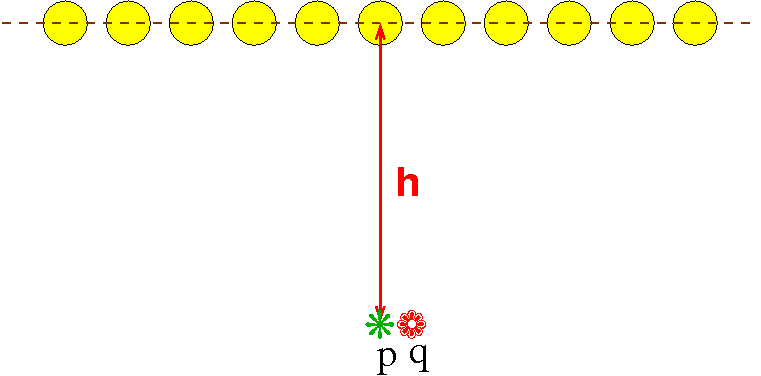
    Imagine that you have an infinitely large room illuminated by one infinitely long row of point lights. This figure shows a side view of the room.

    The lights are h above the floor and are 1 meter from each other. Assume that the ceiling above the lights is black and that no light reflects off of anything.

    An object at distance d from a light gets illuminated with a brightness \(\frac{1}{d^2}\).

    Each point on the floor is illuminated by all the lights, but more brightly by the closer lights.

    A point p directly below a light will be a little brighter than a point q halfway between two such points. That is the problem --- we want the floor (at least the part directly below the line of lights) to be evenly lit, at least within 1%.

    However, the higher the line of lights, the more evenly the floor will be lit.

    Your question is to tell us what is the minimum value for h so that the line of the floor below the line of lights is evenly lit within 5%.

    ../../images/hw-lights.png

    E.g., the brightness at p is

    \(b_p = \sum_{i=-\infty}^{\infty} \;\; {1}/{\left(h^2+i^2\right)}\)

    Answer:

    There are several levels of possible solution, all acceptable. The highest is to find the closed form solutions for the integrals. The lowest is to find the numerical approximation for a specific h by summing 1000 terms, and the plotting the difference as a function of h. Part of the point of this problem is that you have to first decide how to solve it. I will use Mathematica, partly to demonstrate that it is useful in graphics.

    The brightness at q is

    \(b_q = {\sum_{i=-\infty}^{\infty}} \;\; {1}/{\left(h^2+(i+1/2)^2\right)}\)

    From Mathematica, \(b_p = {\pi \coth (\pi h)}/{h}\)

    \(b_q = \left({\pi \tanh (\pi h)}/{h}\right)\)

    \(b_q/b_p = \tanh ^2(\pi h)\)

    The plot is this. The X axis is the height of the lights. The Y axis is the ration between the dimmest place on the floor and the brightest place.

    ../../files/hw6-light-ratio.png

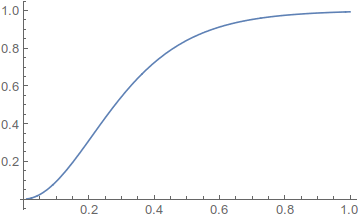
    The lesson from this plot is that the light variation smooths out really quickly as the ceiling gets higher. Eyeballing, at h=.7, the variation is already only 5%. Mathematica can calculate 0.69336. Any number from .65 to .75 is acceptable for grading purposes.

(Total: 20 points.)

CG Class 29, Mon 2017-11-20

2   Textbook programs

  1. Chapter 10 Mandlebrot showing serious computation in the fragment shader.
  2. Chapter 9 simple hierarchical models

CG Class 28, Thurs 2017-11-16

2   Texture mapping programs

ctd

Programs.

  1. I'm not covering all the gruesome details of these programs, but just hitting highlights.

  2. particleDiffusion: buffer ping ponging of 50 particles initially placed randomly and then moving randomly with their previous positions diffused as a texture.

    It renders to a texture instead of to a color buffer. Then it uses the texture.

    There are better descriptions on the web. Search for 'webgl ren der texture'. I'll work with the textbook code. Jumping back and forth is confusing, partly because they might use different utility files.

    There are often better descriptions on the web than in the textbook. I've considered running a course only with web material. What do you think?

    https://developer.mozilla.org/en-US/docs/Web/API/WebGL_API has good documentation.

  3. Several of the programs don't display on my laptop, so I won't show them. They include bumpmap and render.

  4. Cubet: enabling and disabling the depth buffer and drawing translucent objects.

  5. pickcube etc. This prints the name of the name that you pick.

    1. This draws a label for each face into a separate buffer.
    2. Then it indexes into it with the coordinates of the mouse.

4   Chapter 10 slides

  1. 10_1 Reflection and Environment Maps.

  2. 10_2 Bump Maps.

    Perturb the surface normals to emulate small details (bumps).

  3. 10_3 Compositing and Blending.

    Some of this material was removed from the current OpenGL, and some of the remaining stuff hasn't been included in WebGL (yet?). So, you have to learn just the high-level stuff, like what this is and why it's interesting.

    1. Compositing, using partial transparancy, creates complex scenes by blending simple components.
      1. It's hard to do accurately in the pipeline.
      2. Drawing objects back-to-front into the color buffer is a good heuristic.
      3. Clamping and accuracy are concerns.
    2. Fog effects provide a depth cue that helps the viewer understand the image.
    3. Anti-aliasing improves the image quality when there are small objects.
  4. 10_4 Imaging Applications.

    1. The GPU is so powerful that people figure ways to use it to do image processing things that it wasn't intended to.
    2. That started the field of GPGPU.
    3. Nvidia watched this happening and added new features to the GPU, like double-precision IEEE-standard floating point computations, to make this easier.
    4. The top line of Nvidia GPUs is designed for scientific computation and doesn't even have video outputs.
    5. The 2nd fastest known supercomputer has 15000 Nvidia GPUs.
  5. 10_5 Rendering the Mandelbrot Set.

    Show the power of GPU programming.

    The program is in Chapter 10.

5   Aliasing and anti-

  1. The underlying image intensity, as a function of x, is a signal, f(x).
  2. When the objects are small, say when they are far away, f(x) is changing fast.
  3. To display the image, the system evaluates f(x) at each pixel. That is, f(x) is sampled at x=0,1,2,3,...
  4. If f(x), when Fourier transformed, has frequencies higher than 1/2 (cycle per pixel), then that sampling is too coarse to capture the signal. See the Nyquist sampling theorem.
  5. When this hi-freq signal is sampled at too low a frequency, then the result computed for the frame buffer will have visual problems.
  6. It's not just that you won't see the hi frequencies. That's obvious.
  7. Worse, you will see fake low frequency signals that were never in the original scene. They are called '''aliases''' of the hi-freq signals.
  8. These artifacts may jump out at you, because of the Mach band effect.
  9. Aliasing can even cause (in NTSC) rapid intensity changes to cause fake colors and vv.
  10. Aliasing can occur with time signals, like a movie of a spoked wagon wheel.
  11. This is like a strobe effect.
  12. The solution is to filter out the hi frequencies before sampling, or sample with a convolution filter instead of sampling at a point. That's called '''anti-aliasing'''.
  13. OpenGl solutions:
    1. Mipmaps.
    2. Compute scene on a higher-resolution frame buffer and average down.
    3. Consider pixels to be squares not points. Compute the fraction of each pixel covered by each object, like a line. Lines have to have finite width.
  14. Refs:
    1. http://en.wikipedia.org/wiki/Aliasing
    2. http://en.wikipedia.org/wiki/Clear_Type
    3. http://en.wikipedia.org/wiki/Wagon-wheel_effect
    4. http://en.wikipedia.org/wiki/Spatial_anti-aliasing (The H Freeman referenced worked at RPI for 10 years).
    5. http://en.wikipedia.org/wiki/Mipmap
    6. http://en.wikipedia.org/wiki/Jaggies

6   Videos - military applications of graphics

US Military's Futuristic Augmented Reality Battlefield - Augmented Immersive Team Trainer (AITT)

Daqri's Smart Helmet Hands On

HoloLens Review: Microsoft's Version of Augmented Reality

US Military's Futuristic Augmented Reality Battlefield - Augmented Immersive Team Trainer (AITT)

'''Modeling and simulation''' is a standard term.

7   DARPA

  1. I've mentioned DARPA several times; they funded research into computer graphics starting in the 1970s. So here's some enrichment material on DARPA and autonomous vehicles. This shows why the US is the best in the world at R&D.

    Autonomous vehicles make a marvelous example of a successful engineering project. Many different parts all have to work to make the total project succeed. They include laser rangefinding, image recognition, a road database accurate to the specific lane, and GPS navigation. This is also a model for government - university - industry interaction.

    DARPA (The Defense Advanced Research Projects Agency) started this concept with a contest paying several $million in prizes. (DARPA started connecting computers in different cities with phone lines in 1968. This was the ARPAnet. They funded computer graphics in the 1970s and some early steps in virtual reality in the 1980s.)

    In the 1st contest, the best vehicle failed after about 10 miles. Five vehicles completed the 130 mile course in the 2nd contest. The winning project leader was Sebastian Thrun, a Stanford CS prof. He quit and moved to Google, who has now been funding this for several years.

    Finally, Dr Tony Tether, Director of DARPA when this happened, is an RPI BS EE grad. (He went to Stanford for his PhD).

8   Stereo viewing

  1. There are a number of techniques for stereo viewing of movies and videos, dating back to the 19th century.

    1. Make the left image red and the right one blue. Use red-blue glasses.

      This decreases the color experience, but the glasses are cheap.

    2. Polarize the left and right images differently. Movie theatres do this.

      The glasses are cheap. There is full color. The projection process is more complicated (= expensive).

    3. The glasses have shutters that block and clear the left and right eyes in turn. In sync, the TV or projector shows the left or right image.

      The projector is cheaper. The glasses are more expensive.

    4. Use a display with a parallax barrier.

      Only one person can view at a time. No glasses are needed.

    5. Use the fact that your eyes see bright objects faster than they see dim objects. The glasses have a simple grey filter over one eye. Beer companies have used this for commercials.

      No special display is needed. This works only with moving objects.

9   My research

  1. RPI article about a completed project that I was part of:

    A Game-Changing Approach: Using the X-Box Kinect as a Sensor to Conduct Centrifuge Research. Team of Rensselaer Researchers Develop New Visualization Method to Evaluate Erosion Quantity and Pattern, November 8, 2016, by Jessica Otitigbe.

  2. Another RPI article, on my student Viana Gomes de Magalhães: The Winning Algorithm, Oct 17, 2016, by Mary Martialay.

10   Updating web pages

  1. You may change a web page after it has been displayed. Editing elements and even adding or deleting them is allowed.
  2. One of the pick programs changes the displayed text in a div to show what you picked.
  3. Mathjax, the package I use to render LaTeX math in a web page, edits the displayed page to replace the math source with the rendered math.
  4. A standard way to make things appear and disappear is to include at the start all the elements that will be wanted later. Then make them visible or invisible. The tool on my homepage that makes sections expand and collapse does that.
  5. Every time something is changed on the page, the locations of everything on the page have to be recomputed. With a slow web browser, like old versions of IE, you can watch this.

CG Class 27, Mon 2017-11-13

1   Spring parallel computing course

ECSE-4740 Engineering Parallel Computing welcomes students wanting to learn state-of-the-art parallel computing facilities that is also affordable. That is, multicore Intel Xeon and Nvidia GPU.

Qualified students from any department are welcome. You will learn things that will be useful in your work.

2   Homework 7 up

Here.

due next Mon. No programming.

CG Homework 7, due Mon 2017-11-20 2359

  1. (10 pts) Look at Figures 6.37 and 6.38 on pages 310 and 311 of the textbook. Write 50-100 words on why they look different.
  2. (10 pts) Look at Figure 6.39 on page 314 of the textbook. What is it about the spheres that the global model looks different from the local?
  3. (10 pts) Consider the sphere \(x^2+y^2+z^2=169\). What is the normal to the sphere at the point (3,12,-4)? Be sure your normal is normalized.
  4. (10 pts) Consider a block of glass with index of refraction 1.5. Some light is shining straight down on it. This is called normal incidence. How much of the light reflects off the glass and how much transmits into the glass? Hint: Use Fresnel's law.
  5. (10 pts) A small light source that is twice as far away is 1/4 as bright. That is, there is an inverse square fall off for brightness. However, when modeling light in graphics, we usually don't do that. Why?

(Total: 50 points.)