We implemented OVERPROP as C program, and present times on a Sun Sparcstation 10/30 running Unix The test case overlaid the following two maps, as shown in figure 7.
=6.5in

Figure 7: US Counties Versus Hydrography Polygons
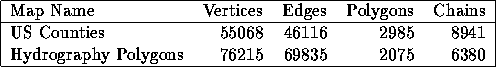
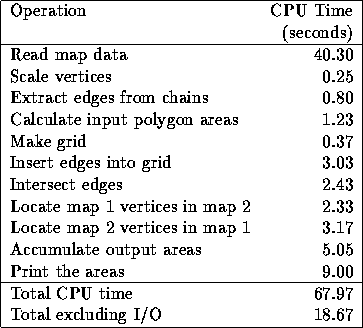
The following times are for a  grid. Reading the
data is so slow because we stored the maps in an ASCII format for
flexibility. For comparison, simply reading the two megabyte
county file takes under 0.1 CPU second, while copying it to
another file takes about 0.3 CPU second. Therefore if the input
were prepared in a binary format compatible with the program's
internal data structures, then the reading time would practically
vanish. Of course, other parts of the program could be sped up
also.
grid. Reading the
data is so slow because we stored the maps in an ASCII format for
flexibility. For comparison, simply reading the two megabyte
county file takes under 0.1 CPU second, while copying it to
another file takes about 0.3 CPU second. Therefore if the input
were prepared in a binary format compatible with the program's
internal data structures, then the reading time would practically
vanish. Of course, other parts of the program could be sped up
also.
The accumulate-areas step refers to applying the half-edge formulæ to the new vertices, once they have been found and classified.
The efficiency of the grid for edge intersections is shown by the fact that of 3,514,730,940 possible edge pairs, only 168,781 pairs were tested, and of those, and 11,207 different intersections were found. Another 7307 duplicate intersections were found and discarded. Duplicates occur when a pair of intersecting edges both pass thru the same several cells.
A common question relates to the uniformity of the data in the cells. An uneven distribution would seem to be inefficient. This problem is worse as the grid gets finer, the data gets more granular, and the distribution less uniform. In fact this has never been a problem for any real data ever tested, either in overlay-area calculation, or in other related programs in computer aided design. Although bad examples are easy to fabricate, the grid structure is tolerant of the amounts of variation that occur in real data.
In this example, with the grid, the worst cell had
25 edges. 60% of the cells were empty, and another 13% had only
one edge, so 73% of the cells required no intersection testing.
26,383 cells had so many edges that they had to have their space
increased. The histogram of number of cells containing each
number of edges is shown in figure
8.

Figure 8: Distribution of Edges per Cell