Profiling Overview
This document describes NVIDIA profiling tools and APIs that enable you to understand and optimize the performance of your CUDA application. The Visual Profiler is a graphical profiling tool that displays a timeline of your application's CPU and GPU activity, and that includes an automated analysis engine to identify optimization opportunities. The Visual Profiler is available as both a standalone application, nvvp, and as part of Nsight Eclipse Edition. The nvprof profiling tool enables you to collect and view profiling data from the command-line. The existing command-line profiler continues to be supported.
What's New
-
The Visual Profiler has been updated with several enhancements:
- Performance is improved when loading large data file. Memory usage is also reduced.
- Visual Profiler timeline is improved to view multi-gpu MPS profile data.
- Unified memory profiling is enhanced by providing fine grain data transfers to and from the GPU, coupled with more accurate timestamps with each transfer.
- nvprof has been updated with several enhancements:
- All events and metrics for devices with compute capability 3.x and 5.0 can now be collected accurately in presence of multiple contexts on the GPU.
Terminology
An event is a countable activity, action, or occurrence on a device. It corresponds to a single hardware counter value which is collected during kernel execution. To see a list of all available events on a particular NVIDIA GPU, type nvprof --query-events.
A metric is a characteristic of an application that is calculated from one or more event values. To see a list of all available metrics on a particular NVIDIA GPU, type nvprof --query-metrics. You can also refer to the metrics reference .
1. Preparing An Application For Profiling
The CUDA profiling tools do not require any application changes to enable profiling; however, by making some simple modifications and additions, you can greatly increase the usability and effectiveness of the profilers. This section describes these modifications and how they can improve your profiling results.
1.1. Focused Profiling
By default, the profiling tools collect profile data over the entire run of your application. But, as explained below, you typically only want to profile the region(s) of your application containing some or all of the performance-critical code. Limiting profiling to performance-critical regions reduces the amount of profile data that both you and the tools must process, and focuses attention on the code where optimization will result in the greatest performance gains.
- The application is a test harness that contains a CUDA implementation of all or part of your algorithm. The test harness initializes the data, invokes the CUDA functions to perform the algorithm, and then checks the results for correctness. Using a test harness is a common and productive way to quickly iterate and test algorithm changes. When profiling, you want to collect profile data for the CUDA functions implementing the algorithm, but not for the test harness code that initializes the data or checks the results.
- The application operates in phases, where a different set of algorithms is active in each phase. When the performance of each phase of the application can be optimized independently of the others, you want to profile each phase separately to focus your optimization efforts.
- The application contains algorithms that operate over a large number of iterations, but the performance of the algorithm does not vary significantly across those iterations. In this case you can collect profile data from a subset of the iterations.
When using the start and stop functions, you also need to instruct the profiling tool to disable profiling at the start of the application. For nvprof you do this with the --profile-from-start off flag. For the Visual Profiler you use the Start execution with profiling enabled checkbox in the Settings View.
1.2. Marking Regions of CPU Activity
The Visual Profiler can collect a trace of the CUDA function calls made by your application. The Visual Profiler shows these calls in the Timeline View, allowing you to see where each CPU thread in the application is invoking CUDA functions. To understand what the application's CPU threads are doing outside of CUDA function calls, you can use the NVIDIA Tools Extension API (NVTX). When you add NVTX markers and ranges to your application, the Timeline View shows when your CPU threads are executing within those regions.
nvprof also supports NVTX markers and ranges. Markers and ranges are shown in the API trace output in the timeline. In summary mode, each range is shown with CUDA activities associated with that range.
1.3. Naming CPU and CUDA Resources
The Visual Profiler Timeline View shows default naming for CPU thread and GPU devices, context and streams. Using custom names for these resources can improve understanding of the application behavior, especially for CUDA applications that have many host threads, devices, contexts, or streams. You can use the NVIDIA Tools Extension API to assign custom names for your CPU and GPU resources. Your custom names will then be displayed in the Timeline View.
nvprof also supports NVTX naming. Names of CUDA devices, contexts and streams are displayed in summary and trace mode. Thread names are displayed in summary mode.
1.4. Flush Profile Data
To reduce profiling overhead, the profiling tools collect and record profile information into internal buffers. These buffers are then flushed asynchronously to disk with low priority to avoid perturbing application behavior. To avoid losing profile information that has not yet been flushed, the application being profiled should make sure, before exiting, that all GPU work is done (using CUDA sychronization calls), and then call cudaDeviceReset(), cudaProfilerStop() or cuProfilerStop(). Doing so forces buffered profile information on corresponding context(s) to be flushed.
If your CUDA application includes graphics that operate using a display or main loop, care must be taken to call cudaDeviceReset(), cudaProfilerStop() or cuProfilerStop() before the thread executing that loop calls exit(). Failure to call one of these APIs may result in the loss of some or all of the collected profile data.
For some graphics applications like the ones use OpenGL, the application exits when the escape key is pressed. In those cases where calling the above functions before exit is not feasible, use nvprof option --timeout or set the "Exection timeout" in the Visual Profiler. The profiler will force a data flush just before the timeout.
1.5. Profiling CUDA Fortran Applications
CUDA Fortran applications compiled with the PGI CUDA Fortran compiler can be profiled by nvprof and the Visual Profiler. In cases where the profiler needs source file and line information (kernel profile analysis, global memory access pattern analysis, divergent execution analysis, etc.), use the "-Mcuda=lineinfo" option when compiling. This option is supported on linux x86 64-bit targets in PGI 2014 version 14.9 or later.
2. Visual Profiler
The NVIDIA Visual Profiler allows you to visualize and optimize the performance of your CUDA application. The Visual Profiler displays a timeline of your application's activity on both the CPU and GPU so that you can identify opportunities for performance improvement. In addition, the Visual Profiler will analyze your application to detect potential performance bottlenecks and direct you on how to take action to eliminate or reduce those bottlenecks.
The Visual Profiler is available as both a standalone application and as part of Nsight Eclipse Edition. The standalone version of the Visual Profiler, nvvp, is included in the CUDA Toolkit for all supported OSes. Within Nsight Eclipse Edition, the Visual Profiler is located in the Profile Perspective and is activated when an application is run in profile mode. Nsight Ecipse Edition, nsight, is included in the CUDA Toolkit for Linux and Mac OSX.
2.1. Getting Started
This section describes the steps you need to take to get started with the Visual Profiler.
2.1.1. Modify Your Application For Profiling
The Visual Profiler does not require any application changes; however, by making some simple modifications and additions, you can greatly increase its usability and effectiveness. Section Preparing An Application For Profiling describes how you can focus your profiling efforts and add extra annotations to your application that will greatly improve your profiling experience.
2.1.2. Creating a Session
The first step in using the Visual Profiler to profile your application is to create a new profiling session. A session contains the settings, data, and results associated with your application. Sessions gives more information on working with sessions.
You can create a new session by selecting the Profile An Application link on the Welcome page, or by selecting New Session from the File menu. In the Create New Session dialog enter the executable for your application. Optionally, you can also specify the working directory, arguments, and environment.
- Start execution with profiling enabled - If selected profile data is collected from the start of application execution. If not selected profile data is not collected until cudaProfilerStart() is called in the application. See Focused Profiling for more information about cudaProfilerStart().
- Enable concurrent kernel profiling - This option should be selected for an application that uses CUDA streams to launch kernels that can execute concurrently. If the application uses only a single stream (and therefore cannot have concurrent kernel execution), deselecting this option may decrease profiling overhead.
- Enable power, clock, and thermal profiling - If selected, power, clock, and thermal conditions on the GPUs will be sampled and displayed on the timeline. Collection of this data is not supported on all GPUs. See the description of the Device timeline in Timeline View for more information.
- Don't run guided analysis - By default guided analysis is run immediately after the creation of a new session. Select this option to disable this behavior.
2.1.3. Analyzing Your Application
If the Don't run guided analysis option was not selected when you created your session, the Visual Profiler will immediately run your application to collect the data needed for the first stage of guided analysis. As described in Analysis View, you can use the guided analysis system to get recommendations on performance limiting behavior in your application.
2.1.4. Exploring the Timeline
In addition to the guided analysis results, you will see a timeline for your application showing the CPU and GPU activity that occurred as your application executed. Read Timeline View and Properties View to learn how to explore the profiling information that is available in the timeline. Navigating the Timeline describes how you can zoom and scroll the timeline to focus on specific areas of your application.
2.1.5. Looking at the Details
In addition to the results provided in the Analysis View, you can also look at the specific metric and event values collected as part of the analysis. Metric and event values are displayed in the Details View. You can collect specific metric and event values that reveal how the kernels in your application are behaving. You collect metrics and events as described in the Details View section.
2.1.6. Improve Loading of Large Profiles
Some applications launch many tiny kernels, making them prone to very large (100s of megabytes or larger) nvprof output, even for application runs of only a few seconds. The Visual Profiler needs roughly the same amount of memory as the size of the profile it is opening/importing. The Java virtual machine may use a fraction of the main memory if no "max heap size" setting is specified. So depending on the size of main memory, Visual Profiler may fail to load some large files.
If the Visual Profiler fails to load a large profile, try setting the max heap size that JVM is allowed to use according to main memory size. You can modify the config file in libnvvp/nvvp.ini in the toolkit installation directory. The nvvp.ini configuration file looks like this:
-data
@user.home/nvvp_workspace
-vm
../jre/bin/java
-vmargs
-Dorg.eclipse.swt.browser.DefaultType=mozilla
To force the JVM to use 3 gigabytes of memory, for example, add a new line with -Xmx3G after -vmargs. The -Xmx setting should be tailored to the available system memory and input size. For example, if your system has 24GB of system memory, and you happen to know that you won't need to run any other memory-intensive applications at the same time as the Visual Profiler, so its okay for the profiler to take up the vast majority of that space. So you might pick, say, 22GB as the maximum heap size, leaving a few gigabytes for the OS, GUI, and any other programs that might be running.
- Increase the default heap size (the one Java automatically starts up with) to, say, 2GB. (-Xms)
- Tell Java to run in 64-bit mode instead of the default 32-bit mode (only works on 64-bit systems); this is required if you want heap sizes >4GB. (-d64)
- Enable Javas parallel garbage collection system, which helps both to decrease the required memory space for a given input size as well as to catch out of memory errors more gracefully. (-XX:+UseConcMarkSweepGC -XX:+CMSIncrementalMode)
Note: most CUDA installations require administrator/root-level access to modify this file.
The modified nvvp.ini file as per examples given above is as follows:
-data
@user.home/nvvp_workspace
-vm
../jre/bin/java
-d64
-vmargs
-Xms2g
-Xmx22g
-XX:+UseConcMarkSweepGC
-XX:+CMSIncrementalMode
-Dorg.eclipse.swt.browser.DefaultType=Mozilla
For more details on JVM settings, consult the Java virtual machine manual.
2.2. Sessions
A session contains the settings, data, and profiling results associated with your application. Each session is saved in a separate file; so you can delete, move, copy, or share a session by simply deleting, moving, copying, or sharing the session file. By convention, the file extension .nvvp is used for Visual Profiler session files.
There are two types of sessions: an executable session that is associated with an application that is executed and profiled from within the Visual Profiler, and an import session that is created by importing data generated by nvprof or the command-line profiler.
2.2.1. Executable Session
You can create a new executable session for your application by selecting the Profile An Application link on the Welcome page, or by selecting New Session from the File menu. Once a session is created, you can edit the session's settings as described in the Settings View.
You can open and save existing sessions using the open and save options in the File menu.
To analyze your application and to collect metric and event values, the Visual Profiler will execute your application multiple times. To get accurate profiling results, it is important that your application conform to the requirements detailed in Application Requirements.
2.2.2. Import Session
You create an import session from the output of nvprof or the command-line profiler by using the Import... option in the File menu. Selecting this option opens the import wizard which guides you through the import process.
Because an executable application is not associated with an import session, the Visual Profiler cannot execute the application to collect additional profile data. As a result, analysis can only be performed with the data that is imported. Also, the Details View will show any imported event and metrics values but new metrics and events cannot be selected and collected for the import session.
2.2.2.1. Import Single-Process nvprof Session
Using the import wizard you can select one or more nvprof data files for import into the new session.
You must have one nvprof data file that contains the timeline information for the session. This data file should be collected by running nvprof with the --output-profile option. You can optionally enable other options such as --system-profiling on, but you should not collect any events or metrics as that will distort the timeline so that it is not representative of the applications true behavior.
You may optionally specify one or more event/metric data files that contain event and metric values for the application. These data files should be collected by running nvprof with one or both of the --events and --metrics options. To collect all the events and metrics that are needed for the guided analysis system, you can simply use the --analysis-metrics option along with the --kernels option to select the kernel(s) to collect events and metrics for. See Remote Profiling for more information.
If you are importing multiple nvprof output files into the session, it is important that your application conform to the requirements detailed in Application Requirements.
2.2.2.2. Import Multi-Process nvprof Session
Using the import wizard you can select multiple nvprof data files for import into the new multi-process session.
Each nvprof data file must contain the timeline information for one of the processes. This data file should be collected by running nvprof with the --output-profile option. You can optionally enable other options such as --system-profiling on, but you should not collect any events or metrics as that will distort the timeline so that it is not representative of the applications true behavior.
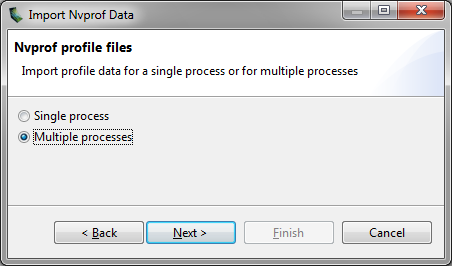
Select the Multiple Processes option in the Import Nvprof Data dialog as shown in the figure below.
When importing timeline data from multiple processes you may not specify any event/metric data files for those processes. Multi-processes profiling is only supported for timeline data.
2.2.2.3. Import Command-Line Profiler Session
Using the import wizard you can select one or more command-line profiler generated CSV files for import into the new session. When you import multiple CSV files, their contents are combined and displayed in a single timeline.
When using the command-line profiler to create a CSV file for import into the Visual Profiler, the following requirement must be met:
- COMPUTE_PROFILE_CSV must be 1 to generate CSV formatted output.
- COMPUTE_PROFILE_CONFIG must point to a file that contains gpustarttimestamp and streamid configuration parameters. The configuration file may also contain other configuration parameters, including events.
2.3. Application Requirements
- For a device, the order of context creation must be the same each time the application executes. For a multi-threaded application where each thread creates its own context(s), care must be taken to ensure that the order of those context creations is consistent across multiple runs. For example, it may be necessary to create the contexts on a single thread and then pass the contexts to the other threads. Alternatively, the NVIDIA Tools Extension API can be used to provide a custom name for each context. As long as the same custom name is applied to the same context on each execution of the application, the Visual Profiler will be able to correctly associate those contexts across multiple runs.
- For a context, the order of stream creation must be the same each time the application executes. Alternatively, the NVIDIA Tools Extension API can be used to provide a custom name for each stream. As long as the same custom name is applied to the same stream on each execution of the application, the Visual Profiler will be able to correctly associate those streams across multiple runs.
- Within a stream, the order of kernel and memcpy invocations must be the same each time the application executes.
2.4. Visual Profiler Views
The Visual Profiler is organized into views. Together, the views allow you to analyze and visualize the performance of your application. This section describes each view and how you use it while profiling your application.
2.4.1. Timeline View
The Timeline View shows CPU and GPU activity that occurred while your application was being profiled. Multiple timelines can be opened in the Visual Profiler at the same time. Each opened timeline is represented by a different instance of the view. The following figure shows a Timeline View for a CUDA application.
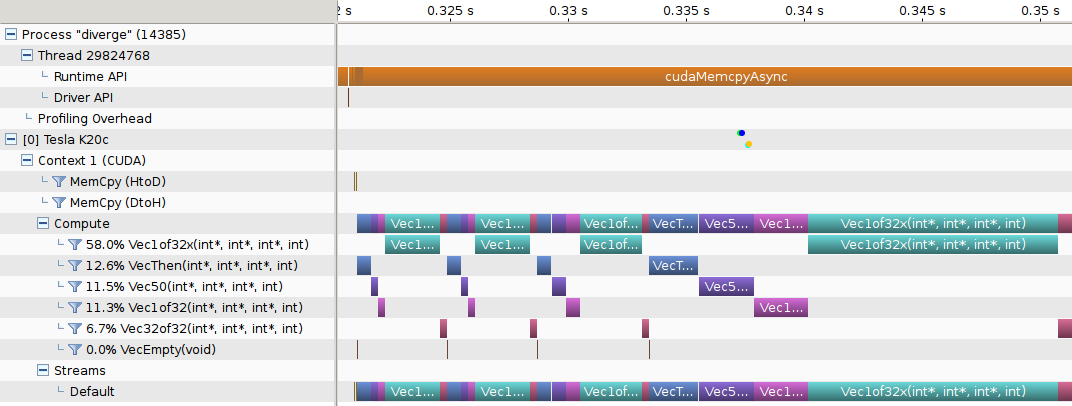
Along the top of the view is a horizontal ruler that shows elapsed time from the start of application profiling. Along the left of the view is a vertical ruler that describes what is being shown for each horizontal row of the timeline, and that contains various controls for the timeline. These controls are described in Timeline Controls
The timeline view is composed of timeline rows. Each row shows intervals that represent the start and end times of the activities that correspond to the type of the row. For example, timeline rows representing kernels have intervals representing the start and end times of executions of that kernel. In some cases (as noted below) a timeline row can display multiple sub-rows of activity. Sub-rows are used when there is overlapping activity. These sub-rows are created dynamically as necessary depending on how much activity overlap there is. The placement of intervals within certain sub-rows does not convey any particular meaning. Intervals are just packed into sub-rows using a heuristic that attempts to minimize the number of needed sub-rows. The height of the sub-rows is scaled to keep vertical space reasonable.
The types of timeline rows that are displayed in the Timeline View are:
- Process
- A timeline will contain a Process row for each application profiled. The process identifier represents the pid of the process. The timeline row for a process does not contain any intervals of activity. Threads within the process are shown as children of the process.
- Thread
- A timeline will contain a Thread row for each CPU thread in the profiled application that performed either a CUDA driver or CUDA runtime API call. The thread identifier is a unique id for that CPU thread. The timeline row for a thread is does not contain any intervals of activity.
- Runtime API
- A timeline will contain a Runtime API row for each CPU thread that performs a CUDA Runtime API call. Each interval in the row represents the duration of the call on the corresponding thread.
- Driver API
- A timeline will contain a Driver API row for each CPU thread that performs a CUDA Driver API call. Each interval in the row represents the duration of the call on the corresponding thread.
- Markers and Ranges
- A timeline will contain a single Markers and Ranges row for each CPU thread that uses the NVIDIA Tools Extension API to annotate a time range or marker. Each interval in the row represents the duration of a time range, or the instantaneous point of a marker. This row will have sub-rows if there are overlapping ranges.
- Profiling Overhead
- A timeline will contain a single Profiling Overhead row for each process. Each interval in the row represents the duration of execution of some activity required for profiling. These intervals represent activity that does not occur when the application is not being profiled.
- Device
- A timeline will contain a Device row for each GPU device utilized by the application being profiled. The name of the timeline row indicates the device ID in square brackets followed by the name of the device. After running the Compute Utilization analysis, the row will contain an estimate of the compute utilization of the device over time. If power, clock, and thermal profiling are enabled, the row will also contain points representing those readings.
- Context
- A timeline will contains a Context row for each CUDA context on a GPU device. The name of the timeline row indicates the context ID or the custom context name if the NVIDIA Tools Extension API was used to name the context. The row for a context does not contain any intervals of activity.
- Memcpy
- A timeline will contain memory copy row(s) for each context that performs memcpys. A context may contain up to four memcpy rows for device-to-host, host-to-device, device-to-device, and peer-to-peer memory copies. Each interval in a row represents the duration of a memcpy executing on the GPU.
- Compute
- A timeline will contain a Compute row for each context that performs computation on the GPU. Each interval in a row represents the duration of a kernel on the GPU device. The Compute row indicates all the compute activity for the context. Sub-rows are used when concurrent kernels are executed on the context. All kernel activity, including kernels launched using CUDA Dynamic Parallelism, is shown on the Compute row. The Kernel rows following the Compute row show activity of each individual application kernel.
- Kernel
- A timeline will contain a Kernel row for each kernel executed by the application. Each interval in a row represents the duration of execution of an instance of that kernel in the containing context. Each row is labeled with a percentage that indicates the total execution time of all instances of that kernel compared to the total execution time of all kernels. For each context, the kernels are ordered top to bottom by this execution time percentage. Sub-rows are used to show concurrent kernel execution. For CUDA Dynamic Parallelism applications, the kernels are organized in a hierarchy that represents the parent/child relationship between the kernels. Host-launched kernels are shown as direct children of the Context row. Kernels that use CUDA Dynamic Parallelism to launch other kernels can be expanded using the '+' icon to show the kernel rows representing those child kernels. For kernels that don't launch child kernels, the kernel execution is represented by a solid interval, showing the time that that instance of the kernel was executing on the GPU. For kernels that launch child kernels, the interval can also include a hollow part at the end. The hollow part represents the time after the kernel has finished executing where it is waiting for child kernels to finish executing. The CUDA Dynamic Parallelism execution model requires that a parent kernel not complete until all child kernels complete and this is what the hollow part is showing. The Focus control described in Timeline Controls can be used to control display of the parent/child timelines.
- Stream
- A timeline will contain a Stream row for each stream used by the application (including both the default stream and any application created streams). Each interval in a Stream row represents the duration of a memcpy or kernel execution performed on that stream.
2.4.1.1. Timeline Controls
The Timeline View has several controls that you use to control how the timeline is displayed. Some of these controls also influence the presentation of data in the Details View and the Analysis View.
Resizing the Vertical Timeline Ruler
The width of the vertical ruler can be adjusted by placing the mouse pointer over the right edge of the ruler. When the double arrow pointer appears, click and hold the left mouse button while dragging. The vertical ruler width is saved with your session.
Reordering Timelines
The Kernel and Stream timeline rows can be reordered. You may want to reorder these rows to aid in visualizing related kernels and streams, or to move unimportant kernels and streams to the bottom of the timeline. To reorder a row, left-click on the row label. When the double arrow pointer appears, drag up or down to position the row. The timeline ordering is saved with your session.
Filtering Timelines
Memcpy and Kernel rows can be filtered to exclude their activities from presentation in the Details View and the Analysis View. To filter out a row, left-click on the filter icon just to the left of the row label. To filter all Kernel or Memcpy rows, Shift-left-click one of the rows. When a row is filtered, any intervals on that row are dimmed to indicate their filtered status.
Expanding and Collapsing Timelines
- Collapsed
- No timeline rows contained in the collapsed row are shown.
- Expanded
- All non-filtered timeline rows are shown.
- All-Expanded
- All timeline rows, filtered and non-filtered, are shown.
Intervals associated with collapsed rows may not be shown in the Details View and the Analysis View, depending on the filtering mode set for those views (see view documentation for more information). For example, if you collapse a device row, then all memcpys, memsets, and kernels associated with that device are excluded from the results shown in those views.
Coloring Timelines
There are three modes for timeline coloring. The coloring mode can be selected in the View menu, in the timeline context menu (accessed by right-clicking in the timeline view), and on the Visual Profiler toolbar. In kernel coloring mode, each type of kernel is assigned a unique color (that is, all activity intervals in a kernel row have the same color). In stream coloring mode, each stream is assigned a unique color (that is, all memcpy and kernel activity occurring on a stream are assigned the same color). In process coloring mode, each process is assigned a unique color (that is, all memcpy and kernel activity occurring in a process are assigned the same color).
Focusing Kernel Timelines
For applications using CUDA Dynamic Parallelism, the Timeline View displays a hierarchy of kernel activity that shows the parent/child relationship between kernels. By default all parent/child relationships are shown simultaneously. The focus timeline control can be used to focus the displayed parent/child relationships to a specific, limited set of "family trees". The focus timeline mode can be selected and deselected in the timeline context menu (accessed by right-clicking in the timeline view), and on the Visual Profiler toolbar.
To see the "family tree" of a particular kernel, select a kernel and then enable Focus mode. All kernels except those that are ancestors or descendants of the selected kernel will be hidden. Ctrl-select can be used to select multiple kernels before enabling Focus mode. Use the "Don't Focus" option to disable focus mode and restore all kernels to the Timeline view.
Timeline Refreshing
The Visual Profiler loads the timeline gradually as it reads the data. This is more visible if the data file being loaded is big, or the application has generated a lot of data. In such cases, the timeline may be partially rendered. At the same time, a spinning circle replaces the icon of the current session tab, indicating the timeline is not fully loaded. Loading is finished when the icon changes back.
To reduce memory footprint, the Visual Profiler may skip loading some timeline contents if they are not visible at the current zoom level. These contents will be automatically loaded when they become visible on a new zoom level.
2.4.2. Analysis View
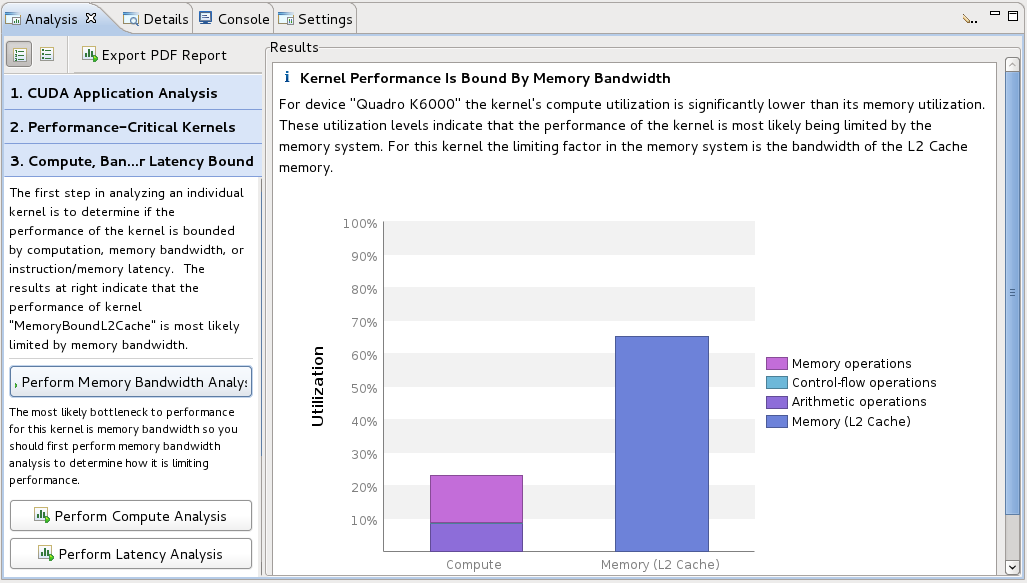
The Analysis View is used to control application analysis and to display the analysis results. There are two analysis modes: guided and unguided. In guided mode the analysis system will guide you though multiple analysis stages to help you understand the likely performance limiters and optimization opportunities in your application. In unguided mode you can manually explore all the analysis results collect for you application. The following figure shows the analysis view in guided analysis mode. The left part of the view provides step-by-step directions to help you analyse and optimize your application. The right part of the view shows you detailed analysis results appropriate for each part of the analysis.
Guided Application Analysis
In guided mode, the analysis view will guide you step-by-step though analysis of your entire application with specific analysis guidance provided for each kernel within your application. Guided analysis starts with CUDA Application Analysis and from there will guide you to optimization opportunities within your application.
Unguided Application Analysis
In unguided analysis mode each application analysis stage has a Run analysis button that can be used to generate the analysis results for that stage. When the Run analysis button is selected, the Visual Profiler will execute the application to collect the profiling data needed to perform the analysis. The green check-mark next to an analysis stage indicates that the analysis results for that stage are available. Each analysis result contains a brief description of the analysis and a More… link to detailed documentation on the analysis. When you select an analysis result, the timeline rows or intervals associated with that result are highlighted in the Timeline View.
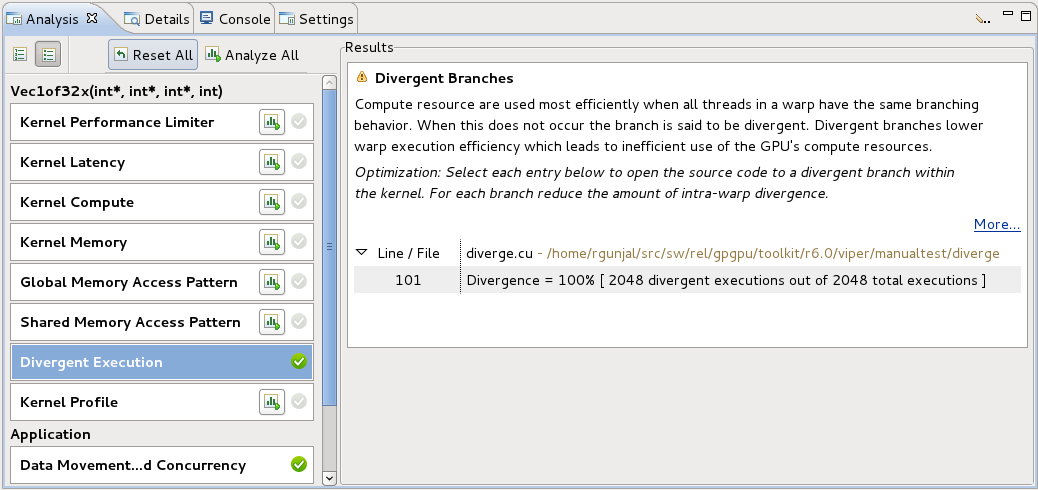
When a single kernel instance is selected in the timeline, additional kernel-specific analysis stages are available. Each kernel-specific analysis stage has a Run analysis button that operates in the same manner as for the application analysis stages. The following figure shows the analysis results for the Divergent Execution analysis stage. Some kernel instance analysis results, like Divergent Execution are associated with specific source-lines within the kernel. To see the source associated with each result, select an entry from the table. The source-file associated with that entry will open.
2.4.3. Details View
The Details View displays a table of information for each memory copy and kernel execution in the profiled application. The following figure shows the table containing several memcpy and kernel executions. Each row of the table contains general information for a kernel execution or memory copy. For kernels, the table will also contain a column for each metric or event value collected for that kernel. In the figure, the Achieved Occupancy column shows the value of that metric for each of the kernel executions.
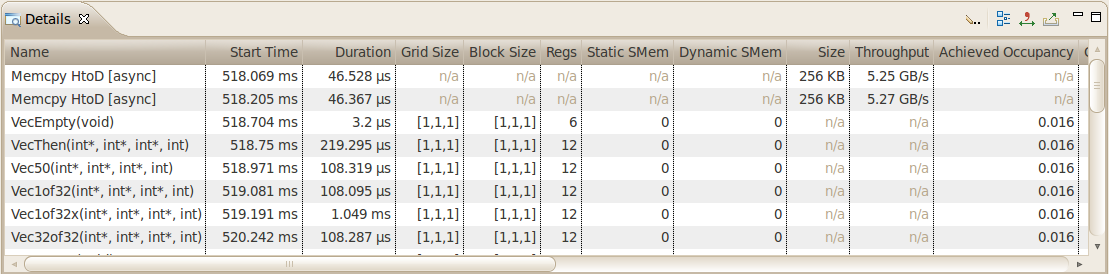
You can sort the data by a column by left clicking on the column header, and you can rearrange the columns by left clicking on a column header and dragging it to its new location. If you select a row in the table, the corresponding interval will be selected in the Timeline View. Similarly, if you select a kernel or memcpy interval in the Timeline View the table will be scrolled to show the corresponding data.
If you hover the mouse over a column header, a tooltip will display describing the data shown in that column. For a column containing event or metric data, the tooltip will describe the corresponding event or metric. Section Metrics Reference contains more detailed information about each metric.
- Filter By Selection - If selected, the Details View shows data only for the selected kernel and memcpy intervals.
- Show Hidden Timeline Data - If not selected, data is shown only for kernels and memcpys that are visible in the timeline. Kernels and memcpys that are not visible because they are inside collapsed parts of the timeline are not shown.
- Show Filtered Timeline Data - If not selected, data is shown only for kernels and memcpys that are in timeline rows that are not filtered.
Collecting Events and Metrics
Specific event and metric values can be collected for each kernel and displayed in the details table. Use the toolbar icon in the upper right corner of the view to configure the events and metrics to collect for each device, and to run the application to collect those events and metrics.
Show Summary Data
By default the table shows one row for each memcpy and kernel invocation. Alternatively, the table can show summary results for each kernel function. Use the toolbar icon in the upper right corner of the view to select or deselect summary format.
Formatting Table Contents
The numbers in the table can be displayed either with or without grouping separators. Use the toolbar icon in the upper right corner of the view to select or deselect grouping separators.
Exporting Details
The contents of the table can be exported in CSV format using the toolbar icon in the upper right corner of the view.
2.4.4. Properties View
The Properties View shows information about the row or interval highlighted or selected in the Timeline View. If a row or interval is not selected, the displayed information tracks the motion of the mouse pointer. If a row or interval is selected, the displayed information is pinned to that row or interval.
2.4.5. Console View
The Console View shows the stdout and stderr output of the application each time it executes. If you need to provide stdin input to you application, you do so by typing into the console view.
2.4.6. Settings View
The Settings View allows you to specify execution settings for the application being profiled. As shown in the following figure, the Executable settings tab allows you to specify the executable file for the application, the working directory for the application, the command-line arguments for the application, and the environment for the application. Only the executable file is required, all other fields are optional.
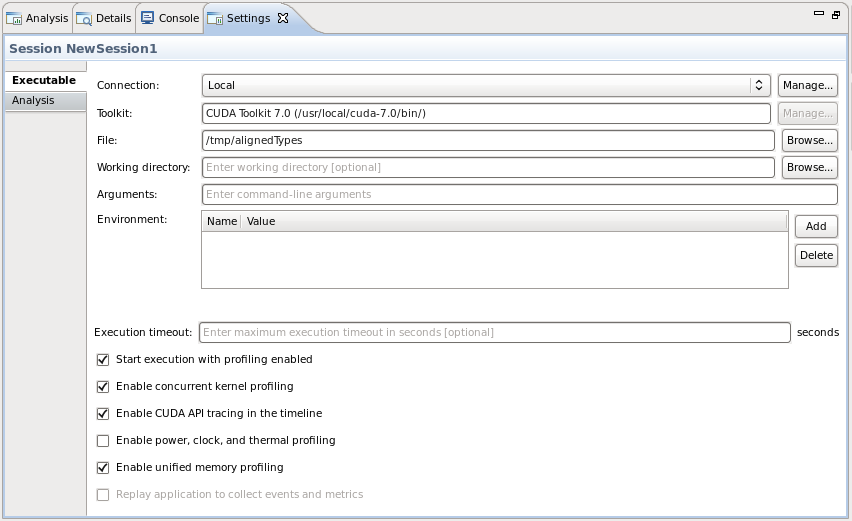
Exection timeout
The Executable settings tab also allows you to specify and optional execution timeout. If the execution timeout is specified, the application execution will be terminated after that number of seconds. If the execution timeout is not specified, the application will be allowed to continue execution until it terminates normally.
Start execution with profiling enabled
The Start execution with profiling enabled checkbox is set by default to indicate that application profiling begins at the start of application execution. If you are using cudaProfilerStart() and cudaProfilerStop() to control profiling within your application as described in Focused Profiling, then you should uncheck this box.
Enable concurrent kernels profiling
The Enable concurrent kernel profiling checkbox is set by default to enable profiling of applications that exploit concurrent kernel execution. If this checkbox is unset, the profiler will disable concurrent kernel execution. Disabling concurrent kernel execution can reduce profiling overhead in some cases and so may be appropriate for applications that do not exploit concurrent kernels.
Enable power, clock, and thermal profiling
The Enable power, clock, and thermal profiling checkbox can be set to enable low frequency sampling of the power, clock, and thermal behavior of each GPU used by the application.
2.5. Customizing the Visual Profiler
When you first start the Visual Profiler, and after closing the Welcome page, you will be presented with a default placement of the views. By moving and resizing the views, you can customize the Visual Profiler to meet you development needs. Any changes you make to the Visual Profiler are restored the next time you start the profiler.
2.5.1. Resizing a View
To resize a view, simply left click and drag on the dividing area between the views. All views stacked together in one area are resized at the same time.
2.5.2. Reordering a View
To reorder a view in a stacked set of views, left click and drag the view tab to the new location within the view stack.
2.5.3. Moving a View
To move a view, left click the view tab and drag it to its new location. As you drag the view, an outline will show the target location for the view. You can place the view in a new location, or stack it in the same location as other views.
2.5.4. Undocking a View
You can undock a view from the Visual Profiler window so that the view occupies its own stand-alone window. You may want to do this to take advantage of multiple monitors or to maximum the size of an individual view. To undock a view, left click the view tab and drag it outside of the Visual Profiler window. To dock a view, left click the view tab (not the window decoration) and drag it into the Visual Profiler window.
Opening and Closing a View
Use the X icon on a view tab to close a view. To open a view, use the View menu.
nvprof
The nvprof profiling tool enables you to collect and view profiling data from the command-line. nvprof enables the collection of a timeline of CUDA-related activities on both CPU and GPU, including kernel execution, memory transfers, memory set and CUDA API calls. nvprof also enables you to collect events/metrics for CUDA kernels. Profiling options are provided to nvprof through command-line options. Profiling results are displayed in the console after the profiling data is collected, and may also be saved for later viewing by either nvprof or the Visual Profiler.
nvprof [options] [CUDA-application] [application-arguments]nvprof and the Command Line Profiler are mutually exclusive profiling tools. If nvprof is invoked when the command-line profiler is enabled, nvprof will report an error and exit.
To view the full help page, type nvprof --help.
3.1. Profiling Modes
nvprof operates in one of the modes listed below.
3.1.1. Summary Mode
Summary mode is the default operating mode for nvprof. In this mode, nvprof outputs a single result line for each kernel function and each type of CUDA memory copy/set performed by the application. For each kernel, nvprof outputs the total time of all instances of the kernel or type of memory copy as well as the average, minimum, and maximum time. The time for a kernel is the kernel execution time on the device. By default, nvprof also prints a summary of all the CUDA runtime/driver API calls. Output of nvprof (except for tables) are prefixed with ==<pid>==, <pid> being the process ID of the application being profiled. Here's a simple example of running nvprof on the CUDA sample matrixMul:
$ nvprof matrixMul
[Matrix Multiply Using CUDA] - Starting...
==27694== NVPROF is profiling process 27694, command: matrixMul
GPU Device 0: "GeForce GT 640M LE" with compute capability 3.0

MatrixA(320,320), MatrixB(640,320)
Computing result using CUDA Kernel...
done
Performance= 35.35 GFlop/s, Time= 3.708 msec, Size= 131072000 Ops, WorkgroupSize= 1024 threads/block
Checking computed result for correctness: OK

Note: For peak performance, please refer to the matrixMulCUBLAS example.
==27694== Profiling application: matrixMul
==27694== Profiling result:
Time(%)      Time     Calls       Avg       Min       Max  Name
 99.94%  1.11524s       301  3.7051ms  3.6928ms  3.7174ms  void matrixMulCUDA<int=32>(float*, float*, float*, int, int)
  0.04%  406.30us         2  203.15us  136.13us  270.18us  [CUDA memcpy HtoD]
  0.02%  248.29us         1  248.29us  248.29us  248.29us  [CUDA memcpy DtoH]

==27964== API calls:
Time(%)      Time     Calls       Avg       Min       Max  Name
 49.81%  285.17ms         3  95.055ms  153.32us  284.86ms  cudaMalloc
 25.95%  148.57ms         1  148.57ms  148.57ms  148.57ms  cudaEventSynchronize
 22.23%  127.28ms         1  127.28ms  127.28ms  127.28ms  cudaDeviceReset
  1.33%  7.6314ms       301  25.353us  23.551us  143.98us  cudaLaunch
  0.25%  1.4343ms         3  478.09us  155.84us  984.38us  cudaMemcpy
  0.11%  601.45us         1  601.45us  601.45us  601.45us  cudaDeviceSynchronize
  0.10%  564.48us      1505     375ns     313ns  3.6790us  cudaSetupArgument
  0.09%  490.44us        76  6.4530us     307ns  221.93us  cuDeviceGetAttribute
  0.07%  406.61us         3  135.54us  115.07us  169.99us  cudaFree
  0.02%  143.00us       301     475ns     431ns  2.4370us  cudaConfigureCall
  0.01%  42.321us         1  42.321us  42.321us  42.321us  cuDeviceTotalMem
  0.01%  33.655us         1  33.655us  33.655us  33.655us  cudaGetDeviceProperties
  0.01%  31.900us         1  31.900us  31.900us  31.900us  cuDeviceGetName
  0.00%  21.874us         2  10.937us  8.5850us  13.289us  cudaEventRecord
  0.00%  16.513us         2  8.2560us  2.6240us  13.889us  cudaEventCreate
  0.00%  13.091us         1  13.091us  13.091us  13.091us  cudaEventElapsedTime
  0.00%  8.1410us         1  8.1410us  8.1410us  8.1410us  cudaGetDevice
  0.00%  2.6290us         2  1.3140us     509ns  2.1200us  cuDeviceGetCount
  0.00%  1.9970us         2     998ns     520ns  1.4770us  cuDeviceGet
If multiple CUDA capable devices are profiled, nvprof --print-summary-per-gpu can be used to print one summary per GPU.
nvprof supports CUDA Dynamic Parallelism in summary mode. If your application uses Dynamic Parallelism, the output will contain one column for the number of host-launched kernels and one for the number of device-launched kernels. Here's an example of running nvprof on the CUDA Dynamic Parallelism sample cdpSimpleQuicksort:
$ nvprof cdpSimpleQuicksort
==27325== NVPROF is profiling process 27325, command: cdpSimpleQuicksort
Running on GPU 0 (Tesla K20c)
Initializing data:
Running quicksort on 128 elements
Launching kernel on the GPU
Validating results: OK
==27325== Profiling application: cdpSimpleQuicksort
==27325== Profiling result:
Time(%)      Time  Calls (host)  Calls (device)       Avg       Min       Max  Name
 99.71%  1.2114ms             1              14  80.761us  5.1200us  145.66us  cdp_simple_quicksort(unsigned int*, int, int, int)
  0.18%  2.2080us             1               -  2.2080us  2.2080us  2.2080us  [CUDA memcpy DtoH]
  0.11%  1.2800us             1               -  1.2800us  1.2800us  1.2800us  [CUDA memcpy HtoD]
3.1.2. GPU-Trace and API-Trace Modes
GPU-Trace and API-Trace modes can be enabled individually or at the same time. GPU-trace mode provides a timeline of all activities taking place on the GPU in chronological order. Each kernel execution and memory copy/set instance is shown in the output. For each kernel or memory copy detailed information such as kernel parameters, shared memory usage and memory transfer throughput are shown. The number shown in the square brackets after the kernel name correlates to the CUDA API that launched that kernel.
Here's an example:
$ nvprof --print-gpu-trace matrixMul
==27706== NVPROF is profiling process 27706, command: matrixMul
==27706== Profiling application: matrixMul
[Matrix Multiply Using CUDA] - Starting...
GPU Device 0: "GeForce GT 640M LE" with compute capability 3.0

MatrixA(320,320), MatrixB(640,320)
Computing result using CUDA Kernel...
done
Performance= 35.36 GFlop/s, Time= 3.707 msec, Size= 131072000 Ops, WorkgroupSize= 1024 threads/block
Checking computed result for correctness: OK

Note: For peak performance, please refer to the matrixMulCUBLAS example.
==27706== Profiling result:
   Start  Duration            Grid Size      Block Size     Regs*    SSMem*    DSMem*      Size  Throughput           Device   Context    Stream  Name
133.81ms  135.78us                    -               -         -         -         -  409.60KB  3.0167GB/s  GeForce GT 640M         1         2  [CUDA memcpy HtoD]
134.62ms  270.66us                    -               -         -         -         -  819.20KB  3.0267GB/s  GeForce GT 640M         1         2  [CUDA memcpy HtoD]
134.90ms  3.7037ms            (20 10 1)       (32 32 1)        29  8.1920KB        0B         -           -  GeForce GT 640M         1         2  void matrixMulCUDA<int=32>(float*, float*, float*, int, int) [94]
138.71ms  3.7011ms            (20 10 1)       (32 32 1)        29  8.1920KB        0B         -           -  GeForce GT 640M         1         2  void matrixMulCUDA<int=32>(float*, float*, float*, int, int) [105]
<...more output...>
1.24341s  3.7011ms            (20 10 1)       (32 32 1)        29  8.1920KB        0B         -           -  GeForce GT 640M         1         2  void matrixMulCUDA<int=32>(float*, float*, float*, int, int) [2191]
1.24711s  3.7046ms            (20 10 1)       (32 32 1)        29  8.1920KB        0B         -           -  GeForce GT 640M         1         2  void matrixMulCUDA<int=32>(float*, float*, float*, int, int) [2198]
1.25089s  248.13us                    -               -         -         -         -  819.20KB  3.3015GB/s  GeForce GT 640M         1         2  [CUDA memcpy DtoH]

Regs: Number of registers used per CUDA thread. This number includes registers used internally by the CUDA driver and/or tools and can be more than what the compiler shows.
SSMem: Static shared memory allocated per CUDA block.
DSMem: Dynamic shared memory allocated per CUDA block.
nvprof supports CUDA Dynamic Parallelism in GPU-trace mode. For host kernel launch, the kernel ID will be shown. For device kernel launch, the kernel ID, parent kernel ID and parent block will be shown. Here's an example:
$nvprof --print-gpu-trace cdpSimpleQuicksort
==28128== NVPROF is profiling process 28128, command: cdpSimpleQuicksort
Running on GPU 0 (Tesla K20c)
Initializing data:
Running quicksort on 128 elements
Launching kernel on the GPU
Validating results: OK
==28128== Profiling application: cdpSimpleQuicksort
==28128== Profiling result:
   Start  Duration            Grid Size      Block Size     Regs*    SSMem*    DSMem*      Size  Throughput           Device   Context    Stream          ID   Parent ID         Parent Block  Name
192.76ms  1.2800us                    -               -         -         -         -      512B  400.00MB/s   Tesla K20c (0)         1         2           -           -                    -  [CUDA memcpy HtoD]
193.31ms  146.02us              (1 1 1)         (1 1 1)        32        0B        0B         -           -   Tesla K20c (0)         1         2           2           -                    -  cdp_simple_quicksort(unsigned int*, int, int, int) [171]
193.41ms  110.53us              (1 1 1)         (1 1 1)        32        0B      256B         -           -   Tesla K20c (0)         1         2          -5           2              (0 0 0)  cdp_simple_quicksort(unsigned int*, int, int, int)
193.45ms  125.57us              (1 1 1)         (1 1 1)        32        0B      256B         -           -   Tesla K20c (0)         1         2          -6           2              (0 0 0)  cdp_simple_quicksort(unsigned int*, int, int, int)
193.48ms  9.2480us              (1 1 1)         (1 1 1)        32        0B      256B         -           -   Tesla K20c (0)         1         2          -7          -5              (0 0 0)  cdp_simple_quicksort(unsigned int*, int, int, int)
193.52ms  107.23us              (1 1 1)         (1 1 1)        32        0B      256B         -           -   Tesla K20c (0)         1         2          -8          -5              (0 0 0)  cdp_simple_quicksort(unsigned int*, int, int, int)
193.53ms  93.824us              (1 1 1)         (1 1 1)        32        0B      256B         -           -   Tesla K20c (0)         1         2          -9          -6              (0 0 0)  cdp_simple_quicksort(unsigned int*, int, int, int)
193.57ms  117.47us              (1 1 1)         (1 1 1)        32        0B      256B         -           -   Tesla K20c (0)         1         2         -10          -6              (0 0 0)  cdp_simple_quicksort(unsigned int*, int, int, int)
193.58ms  5.0560us              (1 1 1)         (1 1 1)        32        0B      256B         -           -   Tesla K20c (0)         1         2         -11          -8              (0 0 0)  cdp_simple_quicksort(unsigned int*, int, int, int)
193.62ms  108.06us              (1 1 1)         (1 1 1)        32        0B      256B         -           -   Tesla K20c (0)         1         2         -12          -8              (0 0 0)  cdp_simple_quicksort(unsigned int*, int, int, int)
193.65ms  113.34us              (1 1 1)         (1 1 1)        32        0B      256B         -           -   Tesla K20c (0)         1         2         -13         -10              (0 0 0)  cdp_simple_quicksort(unsigned int*, int, int, int)
193.68ms  29.536us              (1 1 1)         (1 1 1)        32        0B      256B         -           -   Tesla K20c (0)         1         2         -14         -12              (0 0 0)  cdp_simple_quicksort(unsigned int*, int, int, int)
193.69ms  22.848us              (1 1 1)         (1 1 1)        32        0B      256B         -           -   Tesla K20c (0)         1         2         -15         -10              (0 0 0)  cdp_simple_quicksort(unsigned int*, int, int, int)
193.71ms  130.85us              (1 1 1)         (1 1 1)        32        0B      256B         -           -   Tesla K20c (0)         1         2         -16         -13              (0 0 0)  cdp_simple_quicksort(unsigned int*, int, int, int)
193.73ms  62.432us              (1 1 1)         (1 1 1)        32        0B      256B         -           -   Tesla K20c (0)         1         2         -17         -12              (0 0 0)  cdp_simple_quicksort(unsigned int*, int, int, int)
193.76ms  41.024us              (1 1 1)         (1 1 1)        32        0B      256B         -           -   Tesla K20c (0)         1         2         -18         -13              (0 0 0)  cdp_simple_quicksort(unsigned int*, int, int, int)
193.92ms  2.1760us                    -               -         -         -         -      512B  235.29MB/s   Tesla K20c (0)         1         2           -           -                    -  [CUDA memcpy DtoH]

Regs: Number of registers used per CUDA thread. This number includes registers used internally by the CUDA driver and/or tools and can be more than what the compiler shows.
SSMem: Static shared memory allocated per CUDA block.
DSMem: Dynamic shared memory allocated per CUDA block.
API-trace mode shows the timeline of all CUDA runtime and driver API calls invoked on the host in chronological order. Here's an example:
$nvprof --print-api-trace matrixMul
==27722== NVPROF is profiling process 27722, command: matrixMul
==27722== Profiling application: matrixMul
[Matrix Multiply Using CUDA] - Starting...
GPU Device 0: "GeForce GT 640M LE" with compute capability 3.0

MatrixA(320,320), MatrixB(640,320)
Computing result using CUDA Kernel...
done
Performance= 35.35 GFlop/s, Time= 3.708 msec, Size= 131072000 Ops, WorkgroupSize= 1024 threads/block
Checking computed result for correctness: OK

Note: For peak performance, please refer to the matrixMulCUBLAS example.
==27722== Profiling result:
   Start  Duration  Name
108.38ms  6.2130us  cuDeviceGetCount
108.42ms     840ns  cuDeviceGet
108.42ms  22.459us  cuDeviceGetName
108.45ms  11.782us  cuDeviceTotalMem
108.46ms     945ns  cuDeviceGetAttribute
149.37ms  23.737us  cudaLaunch (void matrixMulCUDA<int=32>(float*, float*, float*, int, int) [2198])
149.39ms  6.6290us  cudaEventRecord
149.40ms  1.10156s  cudaEventSynchronize
<...more output...>
1.25096s  21.543us  cudaEventElapsedTime
1.25103s  1.5462ms  cudaMemcpy
1.25467s  153.93us  cudaFree
1.25483s  75.373us  cudaFree
1.25491s  75.564us  cudaFree
1.25693s  10.901ms  cudaDeviceReset
3.1.3. Event/metric Summary Mode
To see a list of all available events on a particular NVIDIA GPU, type nvprof --query-events. To see a list of all available metrics on a particular NVIDIA GPU, type nvprof --query-metrics. nvprof is able to collect multiple events/metrics at the same time. Here's an example:
$ nvprof --events warps_launched,branch --metrics ipc matrixMul
[Matrix Multiply Using CUDA] - Starting...
==60544== NVPROF is profiling process 60544, command: matrixMul
GPU Device 0: "GeForce GT 640M LE" with compute capability 3.0

MatrixA(320,320), MatrixB(640,320)
Computing result using CUDA Kernel...
==60544== Some kernel(s) will be replayed on device 0 in order to collect all events/metrics.
done
Performance= 7.75 GFlop/s, Time= 16.910 msec, Size= 131072000 Ops, WorkgroupSize= 1024 threads/block
Checking computed result for correctness: OK

Note: For peak performance, please refer to the matrixMulCUBLAS example.
==60544== Profiling application: matrixMul
==60544== Profiling result:
==60544== Event result:
Invocations                      Event Name         Min         Max         Avg
Device "GeForce GT 640M LE (0)"
        Kernel: void matrixMulCUDA<int=32>(float*, float*, float*, int, int)
        301                  warps_launched        6400        6400        6400
        301                          branch       70400       70400       70400

==60544== Metric result:
Invocations                     Metric Name              Metric Description         Min         Max         Avg
Device "GeForce GT 640M LE (0)"
        Kernel: void matrixMulCUDA<int=32>(float*, float*, float*, int, int)
        301                             ipc                    Executed IPC    1.386412    1.393312    1.390278
If the specified events/metrics can't be profiled in a single run of the application, nvprof by default replays each kernel multiple times until all the events/metrics are collected.
Option --replay-mode <mode> can be used to change the replay mode. In "application replay" mode, nvprof re-runs the whole application instead of replaying each kernel, in order to collect all events/metrics. This in some cases can be faster than kernel replay mode if the application allocates large amount of device memory. Replay can also be turned off, in which case the profiler will fail to collect some events/metrics.
To collect all events available on each device, use option --events all.
To collect all metrics available on each device, use option --metrics all.
3.1.4. Event/metric Trace Mode
In event/metric trace mode, event and metric values are shown for each kernel execution. By default, event and metric values are aggregated across all units in the GPU. For example, by default multiprocessor specific events are aggregated across all multiprocessors on the GPU. If --aggregate-mode off is specified, values of each unit are shown. For example, in the following example, the "branch" event value is shown for each multiprocessor on the GPU.
$ nvprof --aggregate-mode off --events branch --print-gpu-trace matrixMul
[Matrix Multiply Using CUDA] - Starting...
==60642== NVPROF is profiling process 60642, command: matrixMul
GPU Device 0: "GeForce GT 640M LE" with compute capability 3.0

MatrixA(320,320), MatrixB(640,320)
Computing result using CUDA Kernel...
done
Performance= 23.73 GFlop/s, Time= 5.523 msec, Size= 131072000 Ops, WorkgroupSize= 1024 threads/block
Checking computed result for correctness: OK

Note: For peak performance, please refer to the matrixMulCUBLAS example.
==60642== Profiling application: matrixMul
==60642== Profiling result:
         Device          Context           Stream                Kernel  branch (0)  branch (1)
GeForce GT 640M                1                2  void matrixMulCUDA<i       35200       35200
GeForce GT 640M                1                2  void matrixMulCUDA<i       35200       35200
<...more output...>
3.2. Profiling Controls
3.2.1. Timeout
A timeout (in seconds) can be provided to nvprof. The CUDA application being profiled will be killed by nvprof after the timeout. Profiling result collected before the timeout will be shown.
3.2.2. Concurrent Kernels
Concurrent-kernel profiling is supported, and is turned on by default. To turn the feature off, use the option --concurrent-kernels off. This forces concurrent kernel executions to be serialized when a CUDA application is run with nvprof.
3.2.3. Profiling Scope
When collecting events/metrics, nvprof profiles all kernels launched on all visible CUDA devices by default. This profiling scope can be limited by the following options.
--devices <device IDs> applies to --events, --metrics, --query-events and --query-metrics options that follows it. It limits these options to collect events/metrics only on the devices specified by <device IDs>, which can be a list of device ID numbers separated by comma.
--kernels <kernel filter> applies to --events and --metrics options that follows it. It limits these options to collect events/metrics only on the kernels specified by <kernel filter>, which has the following syntax:
<kernel name>
or
<context id/name>:<stream id/name>:<kernel name>:<invocation>
Each string in the angle brackets can be a standard Perl regular expression. Empty string matches any number or character combination.
Invocation number n indicates the nth invocation of the kernel. If invocation is a positive number, it's strictly matched against the invocation of the kernel. Otherwise it's treated as a regular expression.
If the context/stream string is a positive number, it's strictly matched against the cuda context/stream ID. Otherwise it's treated as a regular expression and matched against the context/stream name provided by the NVIDIA Tools Extension.
Both --devices and --kernels can be specified multiple times, with distinct events/metrics associated.
--events, --metrics, --query-events and --query-metrics are controlled by the nearest scope options before them.
As an example, the following command,
nvprof --devices 0 --metrics ipc --kernels "1:foo:bar:2" --events local_load a.out
collects metric ipc on all kernels launched on device 0. It also collects event local_load for any kernel whose name contains bar and is the 2nd instance launched on context 1 and on stream named foo on device 0.
3.2.4. Multiprocess Profiling
By default, nvprof only profiles the application specified by the command-line argument. It doesn't trace child processes launched by that process. To profile all processes launched by an application, use the --profile-child-process option.
nvprof also has a "profile all processes" mode, in which it profiles every CUDA process launched on the same system by the same user who launched nvprof. Exit this mode by typing "Ctrl-c".
3.2.5. System Profiling
For devices that support system profiling, nvprof can enable low frequency sampling of the power, clock, and thermal behavior of each GPU used by the application. This feature is turned off by default. To turn on this feature, use --system-profiling on. To see the detail of each sample point, combine the above option with --print-gpu-trace.
3.2.6. Unified Memory Profiling
For devices that support Unified Memory, nvprof collects the Unified Memory related memory traffic to and from each GPU on your system. This feature is turned off by default. To turn on this feature, use --unified-memory-profiling <per-process-device|off>. To see the detail of each memory transfer, combine the above option with --print-gpu-trace.
On multi-GPU configurations without P2P support between any pair of devices that support Unified Memory, managed memory allocations are placed in zero-copy memory. In this case Unified Memory profiling is not supported. In certain cases, the environment variable CUDA_MANAGED_FORCE_DEVICE_ALLOC can be set to force managed allocations to be in device memory and to enable migration on these hardware configurations. In this case Unified Memory profiling is supported. Normally, using the environment variable CUDA_VISIBLE_DEVICES is recommended to restrict CUDA to only use those GPUs that have P2P support. Please refer to the environment variables section in the CUDA C Programming Guide for further details.
3.3. Output
3.3.1. Adjust Units
By default, nvprof adjusts the time units automatically to get the most precise time values. The --normalized-time-unit options can be used to get fixed time units throughout the results.
3.3.2. CSV
For each profiling mode, option --csv can be used to generate output in comma-separated values (CSV) format. The result can be directly imported to spreadsheet software such as Excel.
3.3.3. Export/Import
For each profiling mode, option --output-profile can be used to generate a result file. This file is not human-readable, but can be imported to nvprof using the option --import-profile, or into the Visual Profiler.
3.3.4. Demangling
By default, nvprof demangles C++ function names. Use option --demangling off to turn this feature off.
3.3.5. Redirecting Output
By default, nvprof sends most of its output to stderr. To redirect the output, use --log-file. --log-file %1 tells nvprof to redirect all output to stdout. --log-file <filename> redirects output to a file. Use %p in the filename to be replaced by the process ID of nvprof, %h by the hostname , %q{ENV} by the value of environment variable ENV, and %% by %.
Command Line Profiler
The Command Line Profiler is a profiling tool that can be used to measure performance and find potential opportunities for optimization for CUDA applications executing on NVIDIA GPUs. The command line profiler allows users to gather timing information about kernel execution and memory transfer operations. Profiling options are controlled through environment variables and a profiler configuration file. Profiler output is generated in text files either in Key-Value-Pair (KVP) or Comma Separated (CSV) format.
4.1. Command Line Profiler Control
The command line profiler is controlled using the following environment variables:
COMPUTE_PROFILE: is set to either 1 or 0 (or unset) to enable or disable profiling.
COMPUTE_PROFILE_LOG: is set to the desired file path for profiling output. In case of multiple contexts you must add '%d' in the COMPUTE_PROFILE_LOG name. This will generate separate profiler output files for each context - with '%d' substituted by the context number. Contexts are numbered starting with zero. In case of multiple processes you must add '%p' in the COMPUTE_PROFILE_LOG name. This will generate separate profiler output files for each process - with '%p' substituted by the process id. If there is no log path specified, the profiler will log data to "cuda_profile_%d.log" in case of a CUDA context ('%d' is substituted by the context number).
COMPUTE_PROFILE_CSV: is set to either 1 (set) or 0 (unset) to enable or disable a comma separated version of the log output.
COMPUTE_PROFILE_CONFIG: is used to specify a config file for selecting profiling options and performance counters.
Configuration details are covered in a subsequent section.
The following old environment variables used for the above functionalities are still supported:
CUDA_PROFILE
CUDA_PROFILE_LOG
CUDA_PROFILE_CSV
CUDA_PROFILE_CONFIG
4.2. Command Line Profiler Default Output
Table 1 describes the columns that are output in the profiler log by default.
| Column | Description |
|---|---|
|
method |
This is character string which gives the name of the GPU kernel or memory copy method. In case of kernels the method name is the mangled name generated by the compiler. |
|
gputime |
This column gives the execution time for the GPU kernel or memory copy method. This value is calculated as (gpuendtimestamp - gpustarttimestamp)/1000.0. The column value is a single precision floating point value in microseconds. |
|
cputime |
For non-blocking methods the cputime is only the CPU or host side overhead to launch the method. In this case: walltime = cputime + gputime For blocking methods cputime is the sum of gputime and CPU overhead. In this case: walltime = cputime Note all kernel launches by default are non-blocking. But if any of the profiler counters are enabled kernel launches are blocking. Also asynchronous memory copy requests in different streams are non-blocking. The column value is a single precision floating point value in microseconds. |
|
occupancy |
This column gives the multiprocessor occupancy which is the ratio of number of active warps to the maximum number of warps supported on a multiprocessor of the GPU. This is helpful in determining how effectively the GPU is kept busy. This column is output only for GPU kernels and the column value is a single precision floating point value in the range 0.0 to 1.0. |
4.3. Command Line Profiler Configuration
The profiler configuration file is used to select the profiler options and counters which are to be collected during application execution. The configuration file is a simple format text file with one option on each line. Options can be commented out using the # character at the start of a line. Refer the command line profiler options table for the column names in the profiler output for each profiler configuration option.
4.3.1. Command Line Profiler Options
Table 2 contains the options supported by the command line profiler. Note the following regarding the profiler log that is produced from the different options:
- Typically, each profiler option corresponds to a single column is output. There are a few exceptions in which case multiple columns are output; these are noted where applicable in Table 2.
- In most cases the column name is the same as the option name; the exceptions are listed in Table 2.
- In most cases the column values are 32-bit integers in decimal format; the exceptions are listed in Table 2.
| Option | Description |
|---|---|
|
gpustarttimestamp |
Time stamp when a kernel or memory transfer starts. The column values are 64-bit unsigned value in nanoseconds in hexadecimal format. |
|
gpuendtimestamp |
Time stamp when a kernel or memory transfer completes. The column values are 64-bit unsigned value in nanoseconds in hexadecimal format. |
|
timestamp |
Time stamp when a kernel or memory transfer starts. The column values are single precision floating point value in microseconds. Use of the gpustarttimestamp column is recommended as this provides a more accurate time stamp. |
|
gridsize |
Number of blocks in a grid along the X and Y dimensions for a kernel launch. This option outputs the following two columns:
|
|
gridsize3d |
Number of blocks in a grid along the X, Y and Z dimensions for a kernel launch. This option outputs the following three columns:
|
|
threadblocksize |
Number of threads in a block along the X, Y and Z dimensions for a kernel launch. This option outputs the following three columns:
|
|
dynsmemperblock |
Size of dynamically allocated shared memory per block in bytes for a kernel launch. (Only CUDA) |
|
stasmemperblock |
Size of statically allocated shared memory per block in bytes for a kernel launch. |
|
regperthread |
Number of registers used per thread for a kernel launch. |
|
memtransferdir |
Memory transfer direction, a direction value of 0 is used for host to device memory copies and a value of 1 is used for device to host memory copies. |
|
memtransfersize |
Memory transfer size in bytes. This option shows the amount of memory transferred between source (host/device) to destination (host/device). |
|
memtransferhostmemtype |
Host memory type (pageable or page-locked). This option implies whether during a memory transfer, the host memory type is pageable or page-locked. |
|
streamid |
Stream Id for a kernel launch or a memory transfer. |
|
localblocksize |
This option is no longer supported and if it is selected all values in the column will be -1. This option outputs the following column:
|
|
cacheconfigrequested |
Requested cache configuration option for a kernel launch:
|
|
cacheconfigexecuted |
Cache configuration which was used for the kernel launch. The values are same as those listed under cacheconfigrequested. |
|
cudadevice <device_index> |
This can be used to select different counters for different CUDA devices. All counters after this option are selected only for a CUDA device with index <device_index>. <device_index> is an integer value specifying the CUDA device index. Example: To select counterA for all devices, counterB for CUDA device 0 and counterC for CUDA device 1: counterA cudadevice 0 counterB cudadevice 1 counterC |
|
profilelogformat [CSV|KVP] |
Choose format for profiler log.
The default format is KVP. This option will override the format selected using the environment variable COMPUTE_PROFILE_CSV. |
|
countermodeaggregate |
If this option is selected then aggregate counter values will be output. For a SM counter the counter value is the sum of the counter values from all SMs. For l1*, tex*, sm_cta_launched, uncached_global_load_transaction and global_store_transaction counters the counter value is collected for 1 SM from each GPC and it is extrapolated for all SMs. This option is supported only for CUDA devices with compute capability 2.0 or higher. |
|
conckerneltrace |
This option should be used to get gpu start and end timestamp values in case of concurrent kernels. Without this option execution of concurrent kernels is serialized and the timestamps are not correct. Only CUDA devices with compute capability 2.0 or higher support execution of multiple kernels concurrently. When this option is enabled additional code is inserted for each kernel and this will result in some additional execution overhead. This option cannot be used along with profiler counters. In case some counter is given in the configuration file along with "conckerneltrace" then a warning is printed in the profiler output file and the counter will not be enabled. |
|
enableonstart 0|1 |
Use enableonstart 1 option to enable or enableonstart 0 to disable profiling from the start of application execution. If this option is not used then by default profiling is enabled from the start. To limit profiling to a region of your application, CUDA provides functions to start and stop profile data collection. cudaProfilerStart() is used to start profiling and cudaProfilerStop() is used to stop profiling (using the CUDA driver API, you get the same functionality with cuProfilerStart() and cuProfilerStop()). When using the start and stop functions, you also need to instruct the profiling tool to disable profiling at the start of the application. For command line profiler you do this by adding enableonstart 0 in the profiler configuration file. |
Command Line Profiler Counters
The command line profiler supports logging of event counters during kernel execution. The list of available events can be found using nvprof --query-events as described in Event/metric Summary Mode. The event name can be used in the command line profiler configuration file. In every application run only a few counter values can be collected. The number of counters depends on the specific counters selected.
4.4. Command Line Profiler Output
If the COMPUTE_PROFILE environment variable is set to enable profiling, the profiler log records timing information for every kernel launch and memory operation performed by the driver.
Example 1: CUDA Default Profiler Log- No Options or Counters Enabled (File name: cuda_profile_0.log) shows the profiler log for a CUDA application with no profiler configuration file specified.
Example 1: CUDA Default Profiler Log- No Options or Counters Enabled (File name: cuda_profile_0.log)
# CUDA_PROFILE_LOG_VERSION 2.0
# CUDA_DEVICE 0 Tesla C2075
# CUDA_CONTEXT 1
# TIMESTAMPFACTOR fffff6de60e24570
method,gputime,cputime,occupancy
method=[ memcpyHtoD ] gputime=[ 80.640 ] cputime=[ 278.000 ]
method=[ memcpyHtoD ] gputime=[ 79.552 ] cputime=[ 237.000 ]
method=[ _Z6VecAddPKfS0_Pfi ] gputime=[ 5.760 ] cputime=[ 18.000 ] occupancy=[ 1.000 ]
method=[ memcpyDtoH ] gputime=[ 97.472 ] cputime=[ 647.000 ]
The log above in Example 1: CUDA Default Profiler Log- No Options or Counters Enabled (File name: cuda_profile_0.log) shows data for memory copies and a kernel launch. The method label specifies the name of the memory copy method or kernel executed. The gputime and cputime labels specify the actual chip execution time and the driver execution time, respectively. Note that gputime and cputime are in microseconds. The 'occupancy' label gives the ratio of the number of active warps per multiprocessor to the maximum number of active warps for a particular kernel launch. This is the theoretical occupancy and is calculated using kernel block size, register usage and shared memory usage.
Example 2: CUDA Profiler Log- Options and Counters Enabled shows the profiler log of a CUDA application. There are a few options and counters enabled in this example using the profiler configuration file:
gpustarttimestamp
gridsize3d
threadblocksize
dynsmemperblock
stasmemperblock
regperthread
memtransfersize
memtransferdir
streamid
countermodeaggregate
active_warps
active_cycles
Example 2: CUDA Profiler Log- Options and Counters Enabled
# CUDA_PROFILE_LOG_VERSION 2.0
# CUDA_DEVICE 0 Tesla C2075
# CUDA_CONTEXT 1
# TIMESTAMPFACTOR fffff6de5e08e990
gpustarttimestamp,method,gputime,cputime,gridsizeX,gridsizeY,gridsizeZ, threadblocksizeX,threadblocksizeY,threadblocksizeZ,dynsmemperblock, stasmemperblock,regperthread,occupancy,streamid,active_warps, active_cycles,memtransfersize,memtransferdir
gpustarttimestamp=[ 124b9e484b6f3f40 ] method=[ memcpyHtoD ] gputime=[ 80.800 ] cputime=[ 280.000 ] streamid=[ 1 ] memtransfersize=[ 200000 ] memtransferdir=[ 1 ]
gpustarttimestamp=[ 124b9e484b7517a0 ] method=[ memcpyHtoD ] gputime=[ 79.744 ] cputime=[ 232.000 ] streamid=[ 1 ] memtransfersize=[ 200000 ] memtransferdir=[ 1 ]
gpustarttimestamp=[ 124b9e484b8fd8e0 ] method=[ _Z6VecAddPKfS0_Pfi ] gputime=[ 10.016 ] cputime=[ 57.000 ] gridsize=[ 196, 1, 1 ] threadblocksize=[ 256, 1, 1 ] dynsmemperblock=[ 0 ] stasmemperblock=[ 0 ] regperthread=[ 4 ] occupancy=[ 1.000 ] streamid=[ 1 ]active_warps=[ 1545830 ] active_cycles=[ 40774 ]
gpustarttimestamp=[ 124b9e484bb5a2c0 ] method=[ memcpyDtoH ] gputime=[ 98.528 ] cputime=[ 672.000 ] streamid=[ 1 ] memtransfersize=[ 200000 ] memtransferdir=[ 2 ]
The default log syntax is easy to parse with a script, but for spreadsheet analysis it might be easier to use the comma separated format.
When COMPUTE_PROFILE_CSV is set to 1, this same test produces the output log shown in Example 3: CUDA Profiler Log- Options and Counters Enabled in CSV Format.
Example 3: CUDA Profiler Log- Options and Counters Enabled in CSV Format
# CUDA_PROFILE_LOG_VERSION 2.0
# CUDA_DEVICE 0 Tesla C2075
# CUDA_CONTEXT 1
# CUDA_PROFILE_CSV 1
# TIMESTAMPFACTOR fffff6de5d77a1c0
gpustarttimestamp,method,gputime,cputime,gridsizeX,gridsizeY,gridsizeZ, threadblocksizeX,threadblocksizeY,threadblocksizeZ,dynsmemperblock, stasmemperblock,regperthread,occupancy,streamid,active_warps, active_cycles,memtransfersize,memtransferdir
124b9e85038d1800,memcpyHtoD,80.352,286.000,,,,,,,,,,,1,,,200000,1
124b9e850392ee00,memcpyHtoD,79.776,232.000,,,,,,,,,,,1,,,200000,1
124b9e8503af7460,_Z6VecAddPKfS0_Pfi,10.048,59.000,196,1,1,256,1,1,0, 0,4,1.000,1,1532814,42030
5. Remote Profiling
Remote profiling is the process of collecting profile data from a remote system that is different than the host system at which that profile data will be viewed and analyzed. There are two ways to perform remote profiling. You can profile your remote application directly from nsight or nvvp. Or you can use nvprof to collect the profile data on the remote system and then use nvvp on the host system to view and analyze the data.
Remote Profiling With Visual Profiler
This section describes how to perform remote profiling by using the remote capabilities of nsight and nvvp.
Nsight Eclipse Edition supports full remote development including remote building, debugging, and profiling. Using these capabilities you can create a project and launch configuration that allows you to remotely profile your application. See the Nsight Eclipse Edition documentation for more information.
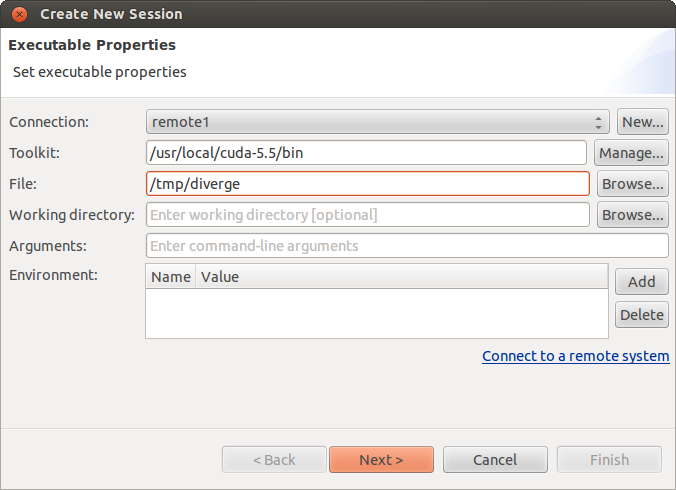
nvvp also enables remote profiling. As shown in the following figure, when creating a new session or editing an existing session you can specify that the application being profiled resides on a remote system. Once you have configured your session to use a remote application, you can perform all Visual Profiler functions in the same way as you would with a local application, including timeline generation, guided analysis, and event and metric collection.
To use nvvp remote profiling you must install the same version of the CUDA Toolkit on both the host and remote systems. It is not necessary for the host system to have an NVIDIA GPU.
Remote Profiling With nvprof
This section describes how to perform remote profiling by running nvprof manually on the remote system and then importing the collected profile data into nvvp.
5.2.1. Collect Data On Remote System
There are three common remote profiling use cases that can be addressed by using nvprof and nvvp.
Timeline
$ nvprof --output-profile timeline.nvprof <app> <app args>
The profile data will be collected in
timeline.nvprof. You should copy this file back to the
host system and then import it into nvvp as
described in the next section.
Metrics And Events
$ nvprof --metrics achieved_occupancy,executed_ipc -o metrics.nvprof <app> <app args>
You can collect any number of events and metrics for each
nvprof invocation, and you can invoke
nvprof multiple times to collect multiple
metrics.nvprof files. To get accurate profiling
results, it is important that your application conform to the
requirements detailed in Application Requirements.
The profile data will be collected in the metrics.nvprof file(s). You should copy these files back to the host system and then import it into nvvp as described in the next section.
Guided Analysis For Individual Kernel
$ nvprof --kernels <kernel specifier> --analysis-metrics -o analysis.nvprof <app> <app args>
The profile data will be collected in
analysis.nvprof. You should copy this file back to the
host system and then import it into nvvp as
described in the next section.
5.2.2. View And Analyze Data
The collected profile data is viewed and analyzed by importing it into nvvp on the host system. See Import Session for more information about importing.
Timeline, Metrics And Events
To view collected timeline data, the timeline.nvprof file can be imported into nvvp as described in Import Single-Process nvprof Session. If metric or event data was also collected for the application, the corresponding metrics.nvprof file(s) can be imported into nvvp along with the timeline so that the events and metrics collected for each kernel are associated with the corresponding kernel in the timeline.
Guided Analysis For Individual Kernel
To view collected analysis data for an individual kernel, the analysis.nvprof file can be imported into nvvp as described in Import Single-Process nvprof Session. The analysis.nvprof must be imported by itself. The timeline will show just the individual kernel that we specified during data collection. After importing, the guided analysis system can be used to explore the optimization opportunities for the kernel.
6. NVIDIA Tools Extension
- Tracing of CPU events and time ranges.
- Naming of OS and CUDA resources.
    void Wait(int waitMilliseconds) {
      nvtxNameOsThread(“MAIN”);
      nvtxRangePush(__FUNCTION__);
      nvtxMark("Waiting...");
      Sleep(waitMilliseconds);
      nvtxRangePop();
    }

    int main(void) {
      nvtxNameOsThread("MAIN");
      nvtxRangePush(__FUNCTION__);
      Wait();
      nvtxRangePop();
    }
6.1. NVTX API Overview
Files
The core NVTX API is defined in file nvToolsExt.h, whereas CUDA-specific extensions to the NVTX interface are defined in nvToolsExtCuda.h and nvToolsExtCudaRt.h. On Linux the NVTX shared library is called libnvToolsExt.so and on Mac OSX the shared library is called libnvToolsExt.dylib. On Windows the library (.lib) and runtime components (.dll) are named nvToolsExt[bitness=32|64]_[version].{dll|lib}.
Function Calls
All NVTX API functions start with an nvtx name prefix and may end with one out of the three suffixes: A, W, or Ex. NVTX functions with these suffixes exist in multiple variants, performing the same core functionality with different parameter encodings. Depending on the version of the NVTX library, available encodings may include ASCII (A), Unicode (W), or event structure (Ex).
The CUDA implementation of NVTX only implements the ASCII (A) and event structure (Ex) variants of the API, the Unicode (W) versions are not supported and have no effect when called.
Return Values
Some of the NVTX functions are defined to have return values. For example, the nvtxRangeStart() function returns a unique range identifier and nvtxRangePush() function outputs the current stack level. It is recommended not to use the returned values as part of conditional code in the instrumented application. The returned values can differ between various implementations of the NVTX library and, consequently, having added dependencies on the return values might work with one tool, but may fail with another.
6.2. NVTX API Events
Markers are used to describe events that occur at a specific time during the execution of an application, while ranges detail the time span in which they occur. This information is presented alongside all of the other captured data, which makes it easier to understand the collected information. All markers and ranges are identified by a message string. The Ex version of the marker and range APIs also allows category, color, and payload attributes to be associated with the event using the event attributes structure.
6.2.1. NVTX Markers
A marker is used to describe an instantaneous event. A marker can contain a text message or specify additional information using the event attributes structure. Use nvtxMarkA to create a marker containing an ASCII message. Use nvtxMarkEx() to create a marker containing additional attributes specified by the event attribute structure. The nvtxMarkW() function is not supported in the CUDA implementation of NVTX and has no effect if called.
Code Example
    nvtxMarkA("My mark");

    nvtxEventAttributes_t eventAttrib = {0};
    eventAttrib.version = NVTX_VERSION;
    eventAttrib.size = NVTX_EVENT_ATTRIB_STRUCT_SIZE;
    eventAttrib.colorType = NVTX_COLOR_ARGB;
    eventAttrib.color = COLOR_RED;
    eventAttrib.messageType = NVTX_MESSAGE_TYPE_ASCII;
    eventAttrib.message.ascii = "my mark with attributes";
    nvtxMarkEx(&eventAttrib);
6.2.2. NVTX Range Start/Stop
A start/end range is used to denote an arbitrary, potentially non-nested, time span. The start of a range can occur on a different thread than the end of the range. A range can contain a text message or specify additional information using the event attributes structure. Use nvtxRangeStartA() to create a marker containing an ASCII message. Use nvtxRangeStartEx() to create a range containing additional attributes specified by the event attribute structure. The nvtxRangeStartW() function is not supported in the CUDA implementation of NVTX and has no effect if called. For the correlation of a start/end pair, a unique correlation ID is created that is returned from nvtxRangeStartA() or nvtxRangeStartEx(), and is then passed into nvtxRangeEnd().
Code Example
    // non-overlapping range
    nvtxRangeId_t id1 = nvtxRangeStartA("My range");
    nvtxRangeEnd(id1);

    nvtxEventAttributes_t eventAttrib = {0};
    eventAttrib.version = NVTX_VERSION;
    eventAttrib.size = NVTX_EVENT_ATTRIB_STRUCT_SIZE;
    eventAttrib.colorType = NVTX_COLOR_ARGB;
    eventAttrib.color = COLOR_BLUE;
    eventAttrib.messageType = NVTX_MESSAGE_TYPE_ASCII;
    eventAttrib.message.ascii = "my start/stop range";
    nvtxRangeId_t id2 = nvtxRangeStartEx(&eventAttrib);
    nvtxRangeEnd(id2);

    // overlapping ranges
    nvtxRangeId_t r1 = nvtxRangeStartA("My range 0");
    nvtxRangeId_t r2 = nvtxRangeStartA("My range 1");
    nvtxRangeEnd(r1);
    nvtxRangeEnd(r2);
6.2.3. NVTX Range Push/Pop
A push/pop range is used to denote nested time span. The start of a range must occur on the same thread as the end of the range. A range can contain a text message or specify additional information using the event attributes structure. Use nvtxRangePushA() to create a marker containing an ASCII message. Use nvtxRangePushEx() to create a range containing additional attributes specified by the event attribute structure. The nvtxRangePushW() function is not supported in the CUDA implementation of NVTX and has no effect if called. Each push function returns the zero-based depth of the range being started. The nvtxRangePop() function is used to end the most recently pushed range for the thread. nvtxRangePop() returns the zero-based depth of the range being ended. If the pop does not have a matching push, a negative value is returned to indicate an error.
Code Example
    nvtxRangePushA("outer");
    nvtxRangePushA("inner");
    nvtxRangePop();  // end "inner" range
    nvtxRangePop();  // end "outer" range

    nvtxEventAttributes_t eventAttrib = {0};
    eventAttrib.version = NVTX_VERSION;
    eventAttrib.size = NVTX_EVENT_ATTRIB_STRUCT_SIZE;
    eventAttrib.colorType = NVTX_COLOR_ARGB;
    eventAttrib.color = COLOR_GREEN;
    eventAttrib.messageType = NVTX_MESSAGE_TYPE_ASCII;
    eventAttrib.message.ascii = "my push/pop range";
    nvtxRangePushEx(&eventAttrib);
    nvtxRangePop();
6.2.4. Event Attributes Structure
The events attributes structure, nvtxEventAttributes_t, is used to describe the attributes of an event. The layout of the structure is defined by a specific version of NVTX and can change between different versions of the Tools Extension library.
Attributes
Markers and ranges can use attributes to provide additional information for an event or to guide the tool's visualization of the data. Each of the attributes is optional and if left unspecified, the attributes fall back to a default value.
- Message
- The message field can be used to specify an optional string. The caller must set both the messageType and message fields. The default value is NVTX_MESSAGE_UNKNOWN. The CUDA implementation of NVTX only supports ASCII type messages.
- Category
- The category attribute is a user-controlled ID that can be used to group events. The tool may use category IDs to improve filtering, or for grouping events. The default value is 0.
- Color
- The color attribute is used to help visually identify events in the tool. The caller must set both the colorType and color fields.
- Payload
- The payload attribute can be used to provide additional data for markers and ranges. Range events can only specify values at the beginning of a range. The caller must specify valid values for both the payloadType and payload fields.
Initialization
- Zero the structure
- Set the version field
- Set the size field
It is recommended that the caller use the following method to initialize the event attributes structure.
    nvtxEventAttributes_t eventAttrib = {0};
    eventAttrib.version = NVTX_VERSION;
    eventAttrib.size = NVTX_EVENT_ATTRIB_STRUCT_SIZE;
    eventAttrib.colorType = NVTX_COLOR_ARGB;
    eventAttrib.color = ::COLOR_YELLOW;
    eventAttrib.messageType = NVTX_MESSAGE_TYPE_ASCII;
    eventAttrib.message.ascii = "My event";
    nvtxMarkEx(&eventAttrib);
6.3. NVTX Resource Naming
NVTX resource naming allows custom names to be associated with host OS threads and CUDA resources such as devices, contexts, and streams. The names assigned using NVTX are displayed by the Visual Profiler.
OS Thread
The nvtxNameOsThreadA() function is used to name a host OS thread. The nvtxNameOsThreadW() function is not supported in the CUDA implementation of NVTX and has no effect if called. The following example shows how the current host OS thread can be named.
    // Windows
    nvtxNameOsThread(GetCurrentThreadId(), "MAIN_THREAD");

    // Linux/Mac
    nvtxNameOsThread(pthread_self(), "MAIN_THREAD");
CUDA Runtime Resources
The nvtxNameCudaDeviceA() and nvtxNameCudaStreamA() functions are used to name CUDA device and stream objects, respectively. The nvtxNameCudaDeviceW() and nvtxNameCudaStreamW() functions are not supported in the CUDA implementation of NVTX and have no effect if called. The nvtxNameCudaEventA() and nvtxNameCudaEventW() functions are also not supported. The following example shows how a CUDA device and stream can be named.
    nvtxNameCudaDeviceA(0, "my cuda device 0");

    cudaStream_t cudastream;
    cudaStreamCreate(&cudastream);
    nvtxNameCudaStreamA(cudastream, "my cuda stream");
CUDA Driver Resources
The nvtxNameCuDeviceA(), nvtxNameCuContextA() and nvtxNameCuStreamA() functions are used to name CUDA driver device, context and stream objects, respectively. The nvtxNameCuDeviceW(), nvtxNameCuContextW() and nvtxNameCuStreamW() functions are not supported in the CUDA implementation of NVTX and have no effect if called. The nvtxNameCuEventA() and nvtxNameCuEventW() functions are also not supported. The following example shows how a CUDA device, context and stream can be named.
    CUdevice device;
    cuDeviceGet(&device, 0);
    nvtxNameCuDeviceA(device, "my device 0");

    CUcontext context;
    cuCtxCreate(&context, 0, device);
    nvtxNameCuContextA(context, "my context");

    cuStream stream;
    cuStreamCreate(&stream, 0);
    nvtxNameCuStreamA(stream, "my stream");
7. MPI Profiling
The nvprof profiler and the Command Line Profiler can be used to profile individual MPI processes. The resulting output can be used directly, or can be imported into the Visual Profiler.
7.1. MPI Profiling With nvprof
To use nvprof to collect the profiles of the individual MPI processes, you must tell nvprof to send its output to unique files. In CUDA 5.0 and earlier versions, it was recommended to use a script for this. However, you can now easily do it utilizing the %h , %p and %q{ENV} features of the --output-profile argument to the nvprof command. Below is example run using Open MPI.
$ mpirun -np 2 -host c0-0,c0-1 nvprof -o output.%h.%p.%q{OMPI_COMM_WORLD_LOCAL_RANK} a.out
Alternatively, one can make use of the new feature to turn on profiling on the nodes of interest using the --profile-all-processes argument to nvprof. To do this, you first log into the node you want to profile and start up nvprof there.
$ nvprof --profile-all-processes -o output.%h.%p.%q{OMPI_COMM_WORLD_LOCAL_RANK}
Then you can just run the MPI job as your normally would.
$ mpirun -np 2 -host c0-0,c0-1 a.out
Any processes that run on the node where the --profile-all-processes is running will automatically get profiled. The profiling data will be written to the output files.
Details about what types of additional arguments to use with nvprof can be found in the Multiprocess Profiling and Redirecting Output section. Additional information about how to view the data with nvvp can be found in the Import Single-Process nvprof Session and Import Multi-Process nvprof Session sections.
7.2. MPI Profiling With The Command-Line Profiler
setenv COMPUTE_PROFILE_LOG cuda_profile.%d.%p
If you are running on multiple nodes, you will need to store the profile logs locally, so that
processes with the same ID running on different nodes don't clobber each others log file.
setenv COMPUTE_PROFILE_LOG /tmp/cuda_profile.%d.%p
COMPUTE_PROFILE_LOG and the other command-line profiler
environment variables must get passed to the remote processes of
the job. Most mpiruns have a way to do
this. Examples for Open MPI and MVAPICH2 are shown below using
the simpleMPI program from the CUDA Software Development
Toolkit.
Open MPI
> setenv COMPUTE_PROFILE_LOG /tmp/cuda_profile.%d.%p
> setenv COMPUTE_PROFILE_CSV 1
> setenv COMPUTE_PROFILE_CONFIG /tmp/compute_profile.config
> setenv COMPUTE_PROFILE 1
> mpirun -x COMPUTE_PROFILE_CSV -x COMPUTE_PROFILE -x COMPUTE_PROFILE_CONFIG -x COMPUTE_PROFILE_LOG -np 6 -host c0-5,c0-6,c0-7 simpleMPI
Running on 6 nodes
Average of square roots is: 0.667282
PASSED
MVAPICH2
> mpirun_rsh -np 6 c0-5 c0-5 c0-6 c0-6 c0-7 c0-7 COMPUTE_PROFILE_CSV=1 COMPUTE_PROFILE=1 COMPUTE_PROFILE_CONFIG=/tmp/compute_profile.config COMPUTE_PROFILE_LOG=cuda_profile.%d.%p simpleMPI
Running on 6 nodes
Average of square roots is: 0.667282
PASSED
8. MPS Profiling
You can collect profiling data for a CUDA application using Multi-Process Service(MPS) with nvprof and then view the timeline by importing the data in Visual Profiler.
8.1. MPS profiling with nvprof
nvprof can be run on a particular MPS client or for all MPS clients. Timeline profiling can be done for all MPS clients on the same server. Event or metric profiling results in serialization - only one MPS client will execute at a time.
To profile a CUDA application using MPS:
1) Launch the MPS daemon. Refer the MPS document for details.
nvidia-cuda-mps-control -d
2) Run nvprof with --profile-all-processes argument and to generate separate output files for each process use the %p feature of the --output-profile argument. Note that %p will be replaced by the process id.
nvprof --profile-all-processes -o output_%p
3) Run the application in a separate terminal
4) Exit nvprof by typing "Ctrl-c".
8.2. Viewing MPS timeline in Visual Profiler
Import the nvprof generated data files for each process using the multi-process import option. Refer the Import Multi-Process nvprof Session section.
The figure below shows the MPS timeline view for three processes. The MPS context is identified in the timeline row label as Context MPS. Note that the Compute and kernel timeline row shows three kernels overlapping.
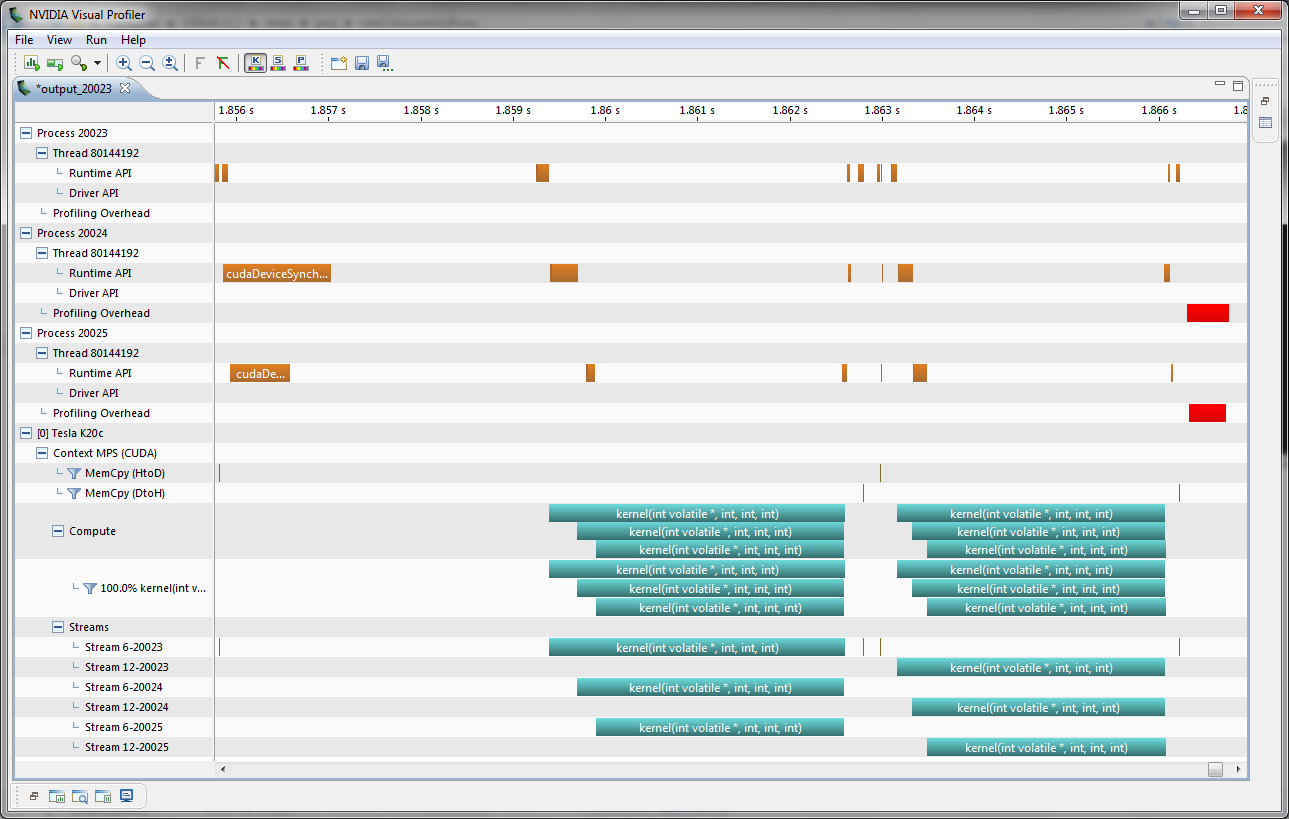
9. Metrics Reference
This section contains detailed descriptions of the metrics that can be collected by nvprof and the Visual Profiler. A scope value of single-context indicates that the metric can only be accurately collected when a single context (CUDA or graphic) is executing on the GPU. A scope value of multi-context indicates that the metric can be accurately collected when multiple contexts are executing on the GPU.
Devices with compute capability between 2.0, inclusive, and 3.0 implement the metrics shown in the following table.
| Metric Name | Description | Scope |
|---|---|---|
| achieved_occupancy | Ratio of the average active warps per active cycle to the maximum number of warps supported on a multiprocessor | Multi-context |
| alu_fu_utilization | The utilization level of the multiprocessor function units that execute integer and floating-point arithmetic instructions on a scale of 0 to 10 | Multi-context |
| atomic_replay_overhead | Average number of replays due to atomic and reduction bank conflicts for each instruction executed | Multi-context |
| atomic_throughput | Global memory atomic and reduction throughput | Multi-context |
| atomic_transactions | Global memory atomic and reduction transactions | Multi-context |
| atomic_transactions_per_request | Average number of global memory atomic and reduction transactions performed for each atomic and reduction instruction | Multi-context |
| branch_efficiency | Ratio of non-divergent branches to total branches expressed as percentage | Multi-context |
| cf_executed | Number of executed control-flow instructions | Multi-context |
| cf_fu_utilization | The utilization level of the multiprocessor function units that execute control-flow instructions on a scale of 0 to 10 | Multi-context |
| cf_issued | Number of issued control-flow instructions | Multi-context |
| dram_read_throughput | Device memory read throughput | Single-context |
| dram_read_transactions | Device memory read transactions | Single-context |
| dram_utilization | The utilization level of the device memory relative to the peak utilization on a scale of 0 to 10 | Single-context |
| dram_write_throughput | Device memory write throughput | Single-context |
| dram_write_transactions | Device memory write transactions | Single-context |
| ecc_throughput | ECC throughput from L2 to DRAM | Single-context |
| ecc_transactions | Number of ECC transactions between L2 and DRAM | Single-context |
| eligible_warps_per_cycle | Average number of warps that are eligible to issue per active cycle | Multi-context |
| flop_count_dp | Number of double-precision floating-point operations executed by non-predicated threads (add, multiply, multiply-accumulate and special). Each multiply-accumulate operation contributes 2 to the count. | Multi-context |
| flop_count_dp_add | Number of double-precision floating-point add operations executed by non-predicated threads | Multi-context |
| flop_count_dp_fma | Number of double-precision floating-point multiply-accumulate operations executed by non-predicated threads. Each multiply-accumulate operation contributes 1 to the count. | Multi-context |
| flop_count_dp_mul | Number of double-precision floating-point multiply operations executed by non-predicated threads | Multi-context |
| flop_count_sp | Number of single-precision floating-point operations executed by non-predicated threads (add, multiply, multiply-accumulate and special). Each multiply-accumulate operation contributes 2 to the count. | Multi-context |
| flop_count_sp_add | Number of single-precision floating-point add operations executed by non-predicated threads | Multi-context |
| flop_count_sp_fma | Number of single-precision floating-point multiply-accumulate operations executed by non-predicated threads. Each multiply-accumulate operation contributes 1 to the count. | Multi-context |
| flop_count_sp_mul | Number of single-precision floating-point multiply operations executed by non-predicated threads | Multi-context |
| flop_count_sp_special | Number of single-precision floating-point special operations executed by non-predicated threads | Multi-context |
| flop_dp_efficiency | Ratio of achieved to peak double-precision floating-point operations | Multi-context |
| flop_sp_efficiency | Ratio of achieved to peak single-precision floating-point operations | Multi-context |
| gld_efficiency | Ratio of requested global memory load throughput to required global memory load throughput expressed as percentage | Single-context |
| gld_requested_throughput | Requested global memory load throughput | Multi-context |
| gld_throughput | Global memory load throughput | Single-context |
| gld_transactions | Number of global memory load transactions | Single-context |
| gld_transactions_per_request | Average number of global memory load transactions performed for each global memory load | Single-context |
| global_cache_replay_overhead | Average number of replays due to global memory cache misses for each instruction executed | Single-context |
| gst_efficiency | Ratio of requested global memory store throughput to required global memory store throughput expressed as percentage | Single-context |
| gst_requested_throughput | Requested global memory store throughput | Multi-context |
| gst_throughput | Global memory store throughput | Single-context |
| gst_transactions | Number of global memory store transactions | Single-context |
| gst_transactions_per_request | Average number of global memory store transactions performed for each global memory store | Single-context |
| inst_bit_convert | Number of bit-conversion instructions executed by non-predicated threads | Multi-context |
| inst_compute_ld_st | Number of compute load/store instructions executed by non-predicated threads | Multi-context |
| inst_control | Number of control-flow instructions executed by non-predicated threads (jump, branch, etc.) | Multi-context |
| inst_executed | The number of instructions executed | Multi-context |
| inst_fp_32 | Number of single-precision floating-point instructions executed by non-predicated threads (arithmetric, compare, etc.) | Multi-context |
| inst_fp_64 | Number of double-precision floating-point instructions executed by non-predicated threads (arithmetric, compare, etc.) | Multi-context |
| inst_integer | Number of integer instructions executed by non-predicated threads | Multi-context |
| inst_inter_thread_communication | Number of inter-thread communication instructions executed by non-predicated threads | Multi-context |
| inst_issued | The number of instructions issued | Multi-context |
| inst_misc | Number of miscellaneous instructions executed by non-predicated threads | Multi-context |
| inst_per_warp | Average number of instructions executed by each warp | Multi-context |
| inst_replay_overhead | Average number of replays for each instruction executed | Multi-context |
| ipc | Instructions executed per cycle | Multi-context |
| ipc_instance | Instructions executed per cycle for a single multiprocessor | Multi-context |
| issue_slot_utilization | Percentage of issue slots that issued at least one instruction, averaged across all cycles | Multi-context |
| issue_slots | The number of issue slots used | Multi-context |
| issued_ipc | Instructions issued per cycle | Multi-context |
| l1_cache_global_hit_rate | Hit rate in L1 cache for global loads | Single-context |
| l1_cache_local_hit_rate | Hit rate in L1 cache for local loads and stores | Single-context |
| l1_shared_utilization | The utilization level of the L1/shared memory relative to peak utilization on a scale of 0 to 10 | Single-context |
| l2_atomic_throughput | Memory read throughput seen at L2 cache for atomic and reduction requests | Sinlge-context |
| l2_atomic_transactions | Memory read transactions seen at L2 cache for atomic and reduction requests | Single-context |
| l2_l1_read_hit_rate | Hit rate at L2 cache for all read requests from L1 cache | Sinlge-context |
| l2_l1_read_throughput | Memory read throughput seen at L2 cache for read requests from L1 cache | Single-context |
| l2_l1_read_transactions | Memory read transactions seen at L2 cache for all read requests from L1 cache | Single-context |
| l2_l1_write_throughput | Memory write throughput seen at L2 cache for write requests from L1 cache | Single-context |
| l2_l1_write_transactions | Memory write transactions seen at L2 cache for all write requests from L1 cache | Single-context |
| l2_read_throughput | Memory read throughput seen at L2 cache for all read requests | Single-context |
| l2_read_transactions | Memory read transactions seen at L2 cache for all read requests | Single-context |
| l2_tex_read_transactions | Memory read transactions seen at L2 cache for read requests from the texture cache | Single-context |
| l2_texture_read_hit_rate | Hit rate at L2 cache for all read requests from texture cache | Single-context |
| l2_texure_read_throughput | Memory read throughput seen at L2 cache for read requests from the texture cache | Sinlge-context |
| l2_utilization | The utilization level of the L2 cache relative to the peak utilization on a scale of 0 to 10 | Single-context |
| l2_write_throughput | Memory write throughput seen at L2 cache for all write requests | Single-context |
| l2_write_transactions | Memory write transactions seen at L2 cache for all write requests | Single-context |
| ldst_executed | Number of executed load and store instructions | Multi-context |
| ldst_fu_utilization | The utilization level of the multiprocessor function units that execute global, local and shared memory instructions on a scale of 0 to 10 | Multi-context |
| ldst_issued | Number of issued load and store instructions | Multi-context |
| local_load_throughput | Local memory load throughput | Single-context |
| local_load_transactions | Number of local memory load transactions | Single-context |
| local_load_transactions_per_request | Average number of local memory load transactions performed for each local memory load | Single-context |
| local_memory_overhead | Ratio of local memory traffic to total memory traffic between the L1 and L2 caches expressed as percentage | Single-context |
| local_replay_overhead | Average number of replays due to local memory accesses for each instruction executed | Single-context |
| local_store_throughput | Local memory store throughput | Single-context |
| local_store_transactions | Number of local memory store transactions | Single-context |
| local_store_transactions_per_request | Average number of local memory store transactions performed for each local memory store | Single-context |
| shared_efficiency | Ratio of requested shared memory throughput to required shared memory throughput expressed as percentage | Single-context |
| shared_load_throughput | Shared memory load throughput | Single-context |
| shared_load_transactions | Number of shared memory load transactions | Single-context |
| shared_load_transactions_per_request | Average number of shared memory load transactions performed for each shared memory load | Single-context |
| shared_replay_overhead | Average number of replays due to shared memory conflicts for each instruction executed | Single-context |
| shared_store_throughput | Shared memory store throughput | Single-context |
| shared_store_transactions | Number of shared memory store transactions | Single-context |
| shared_store_transactions_per_request | Average number of shared memory store transactions performed for each shared memory store | Single-context |
| sm_efficiency | The percentage of time at least one warp is active on a multiprocessor averaged over all multiprocessors on the GPU | Single-context |
| sm_efficiency_instance | The percentage of time at least one warp is active on a specific multiprocessor | Single-context |
| stall_data_request | Percentage of stalls occurring because a memory operation cannot be performed due to the required resources not being available or fully utilized, or because too many requests of a given type are outstanding | Multi-context |
| stall_exec_dependency | Percentage of stalls occurring because an input required by the instruction is not yet available | Multi-context |
| stall_inst_fetch | Percentage of stalls occurring because the next assembly instruction has not yet been fetched | Multi-context |
| stall_other | Percentage of stalls occurring due to miscellaneous reasons | Multi-context |
| stall_sync | Percentage of stalls occurring because the warp is blocked at a __syncthreads() call | Multi-context |
| stall_texture | Percentage of stalls occurring because the texture sub-system is fully utilized or has too many outstanding requests | Multi-context |
| sysmem_read_throughput | System memory read throughput | Single-context |
| sysmem_read_transactions | System memory read transactions | Single-context |
| sysmem_utilization | The utilization level of the system memory relative to the peak utilization on a scale of 0 to 10 | Single-context |
| sysmem_write_throughput | System memory write throughput | Single-context |
| sysmem_write_transactions | System memory write transactions | Single-context |
| tex_cache_hit_rate | Texture cache hit rate | Single-context |
| tex_cache_throughput | Texture cache throughput | Single-context |
| tex_cache_transactions | Texture cache read transactions | Single-context |
| tex_fu_utilization | The utilization level of the multiprocessor function units that execute texture instructions on a scale of 0 to 10 | Multi-context |
| tex_utilization | The utilization level of the texture cache relative to the peak utilization on a scale of 0 to 10 | Single-context |
| warp_execution_efficiency | Ratio of the average active threads per warp to the maximum number of threads per warp supported on a multiprocessor expressed as percentage | Multi-context |
Devices with compute capability between 3.0, inclusive, and 4.0 implement the metrics shown in the following table.
| Metric Name | Description | Scope |
|---|---|---|
| achieved_occupancy | Ratio of the average active warps per active cycle to the maximum number of warps supported on a multiprocessor | Multi-context |
| alu_fu_utilization | The utilization level of the multiprocessor function units that execute integer and floating-point arithmetic instructions on a scale of 0 to 10 | Multi-context |
| atomic_replay_overhead | Average number of replays due to atomic and reduction bank conflicts for each instruction executed | Multi-context |
| atomic_throughput | Global memory atomic and reduction throughput | Multi-context |
| atomic_transactions | Global memory atomic and reduction transactions | Multi-context |
| atomic_transactions_per_request | Average number of global memory atomic and reduction transactions performed for each atomic and reduction instruction | Multi-context |
| branch_efficiency | Ratio of non-divergent branches to total branches expressed as percentage. This is available for compute capability 3.0. | Multi-context |
| cf_executed | Number of executed control-flow instructions | Multi-context |
| cf_fu_utilization | The utilization level of the multiprocessor function units that execute control-flow instructions on a scale of 0 to 10 | Multi-context |
| cf_issued | Number of issued control-flow instructions | Multi-context |
| dram_read_throughput | Device memory read throughput. This is available for compute capability 3.0 and 3.5. | Multi-context |
| dram_read_transactions | Device memory read transactions. This is available for compute capability 3.0 and 3.5. | Multi-context |
| dram_utilization | The utilization level of the device memory relative to the peak utilization on a scale of 0 to 10 | Multi-context |
| dram_write_throughput | Device memory write throughput. This is available for compute capability 3.0 and 3.5. | Multi-context |
| dram_write_transactions | Device memory write transactions. This is available for compute capability 3.0 and 3.5. | Multi-context |
| ecc_throughput | ECC throughput from L2 to DRAM. This is available for compute capability 3.5. | Multi-context |
| ecc_transactions | Number of ECC transactions between L2 and DRAM. This is available for compute capability 3.5. | Multi-context |
| eligible_warps_per_cycle | Average number of warps that are eligible to issue per active cycle | Multi-context |
| flop_count_dp | Number of double-precision floating-point operations executed by non-predicated threads (add, multiply, multiply-accumulate and special). Each multiply-accumulate operation contributes 2 to the count. | Multi-context |
| flop_count_dp_add | Number of double-precision floating-point add operations executed by non-predicated threads | Multi-context |
| flop_count_dp_fma | Number of double-precision floating-point multiply-accumulate operations executed by non-predicated threads. Each multiply-accumulate operation contributes 1 to the count. | Multi-context |
| flop_count_dp_mul | Number of double-precision floating-point multiply operations executed by non-predicated threads | Multi-context |
| flop_count_sp | Number of single-precision floating-point operations executed by non-predicated threads (add, multiply, multiply-accumulate and special). Each multiply-accumulate operation contributes 2 to the count. | Multi-context |
| flop_count_sp_add | Number of single-precision floating-point add operations executed by non-predicated threads | Multi-context |
| flop_count_sp_fma | Number of single-precision floating-point multiply-accumulate operations executed by non-predicated threads. Each multiply-accumulate operation contributes 1 to the count. | Multi-context |
| flop_count_sp_mul | Number of single-precision floating-point multiply operations executed by non-predicated threads | Multi-context |
| flop_count_sp_special | Number of single-precision floating-point special operations executed by non-predicated threads | Multi-context |
| flop_dp_efficiency | Ratio of achieved to peak double-precision floating-point operations | Multi-context |
| flop_sp_efficiency | Ratio of achieved to peak single-precision floating-point operations | Multi-context |
| gld_efficiency | Ratio of requested global memory load throughput to required global memory load throughput expressed as percentage | Multi-context |
| gld_requested_throughput | Requested global memory load throughput | Multi-context |
| gld_throughput | Global memory load throughput | Multi-context |
| gld_transactions | Number of global memory load transactions expressed as percentage | Multi-context |
| gld_transactions_per_request | Average number of global memory load transactions performed for each global memory load | Multi-context |
| global_cache_replay_overhead | Average number of replays due to global memory cache misses for each instruction executed | Multi-context |
| global_replay_overhead | Average number of replays due to global memory cache misses | Multi-context |
| gst_efficiency | Ratio of requested global memory store throughput to required global memory store throughput expressed as percentage | Multi-context |
| gst_requested_throughput | Requested global memory store throughput | Multi-context |
| gst_throughput | Global memory store throughput | Multi-context |
| gst_transactions | Number of global memory store transactions | Multi-context |
| gst_transactions_per_request | Average number of global memory store transactions performed for each global memory store | Multi-context |
| inst_bit_convert | Number of bit-conversion instructions executed by non-predicated threads | Multi-context |
| inst_compute_ld_st | Number of compute load/store instructions executed by non-predicated threads | Multi-context |
| inst_control | Number of control-flow instructions executed by non-predicated threads (jump, branch, etc.) | Multi-context |
| inst_executed | The number of instructions executed | Multi-context |
| inst_fp_32 | Number of single-precision floating-point instructions executed by non-predicated threads (arithmetric, compare, etc.) | Multi-context |
| inst_fp_64 | Number of double-precision floating-point instructions executed by non-predicated threads (arithmetric, compare, etc.) | Multi-context |
| inst_integer | Number of integer instructions executed by non-predicated threads | Multi-context |
| inst_inter_thread_communication | Number of inter-thread communication instructions executed by non-predicated threads | Multi-context |
| inst_issued | The number of instructions issued | Multi-context |
| inst_misc | Number of miscellaneous instructions executed by non-predicated threads | Multi-context |
| inst_per_warp | Average number of instructions executed by each warp | Multi-context |
| inst_replay_overhead | Average number of replays for each instruction executed | Multi-context |
| ipc | Instructions executed per cycle | Multi-context |
| ipc_instance | Instructions executed per cycle for a single multiprocessor | Multi-context |
| issue_slot_utilization | Percentage of issue slots that issued at least one instruction, averaged across all cycles | Multi-context |
| issue_slots | The number of issue slots used | Multi-context |
| issued_ipc | Instructions issued per cycle | Multi-context |
| l1_cache_global_hit_rate | Hit rate in L1 cache for global loads | Multi-context |
| l1_cache_local_hit_rate | Hit rate in L1 cache for local loads and stores | Multi-context |
| l1_shared_utilization | The utilization level of the L1/shared memory relative to peak utilization on a scale of 0 to 10. This is available for compute capability 3.0 and 3.5. | Multi-context |
| l2_atomic_throughput | Memory read throughput seen at L2 cache for atomic and reduction requests | Multi-context |
| l2_atomic_transactions | Memory read transactions seen at L2 cache for atomic and reduction requests | Multi-context |
| l2_l1_read_hit_rate | Hit rate at L2 cache for all read requests from L1 cache. This is available for compute capability 3.0 and 3.5. | Multi-context |
| l2_l1_read_throughput | Memory read throughput seen at L2 cache for read requests from L1 cache. This is available for compute capability 3.0 and 3.5. | Multi-context |
| l2_l1_read_transactions | Memory read transactions seen at L2 cache for all read requests from L1 cache. This is available for compute capability 3.0 and 3.5. | Multi-context |
| l2_l1_write_throughput | Memory write throughput seen at L2 cache for write requests from L1 cache. This is available for compute capability 3.0 and 3.5. | Multi-context |
| l2_l1_write_transactions | Memory write transactions seen at L2 cache for all write requests from L1 cache. This is available for compute capability 3.0 and 3.5. | Multi-context |
| l2_read_throughput | Memory read throughput seen at L2 cache for all read requests | Multi-context |
| l2_read_transactions | Memory read transactions seen at L2 cache for all read requests | Multi-context |
| l2_tex_read_transactions | Memory read transactions seen at L2 cache for read requests from the texture cache | Multi-context |
| l2_texture_read_hit_rate | Hit rate at L2 cache for all read requests from texture cache. This is available for compute capability 3.0 and 3.5. | Multi-context |
| l2_texture_read_throughput | Memory read throughput seen at L2 cache for read requests from the texture cache | Multi-context |
| l2_utilization | The utilization level of the L2 cache relative to the peak utilization on a scale of 0 to 10 | Multi-context |
| l2_write_throughput | Memory write throughput seen at L2 cache for all write requests | Multi-context |
| l2_write_transactions | Memory write transactions seen at L2 cache for all write requests | Multi-context |
| ldst_executed | Number of executed load and store instructions | Multi-context |
| ldst_fu_utilization | The utilization level of the multiprocessor function units that execute global, local and shared memory instructions on a scale of 0 to 10 | Multi-context |
| ldst_issued | Number of issued load and store instructions | Multi-context |
| local_load_throughput | Local memory load throughput | Multi-context |
| local_load_transactions | Number of local memory load transactions | Multi-context |
| local_load_transactions_per_request | Average number of local memory load transactions performed for each local memory load | Multi-context |
| local_memory_overhead | Ratio of local memory traffic to total memory traffic between the L1 and L2 caches expressed as percentage. This is available for compute capability 3.0 and 3.5. | Multi-context |
| local_replay_overhead | Average number of replays due to local memory accesses for each instruction executed | Multi-context |
| local_store_throughput | Local memory store throughput | Multi-context |
| local_store_transactions | Number of local memory store transactions | Multi-context |
| local_store_transactions_per_request | Average number of local memory store transactions performed for each local memory store | Multi-context |
| nc_cache_global_hit_rate | Hit rate in non coherent cache for global loads | Multi-context |
| nc_gld_efficiency | Ratio of requested non coherent global memory load throughput to required non coherent global memory load throughput expressed as percentage | Multi-context |
| nc_gld_requested_throughput | Requested throughput for global memory loaded via non-coherent cache | Multi-context |
| nc_gld_throughput | Non coherent global memory load throughput | Multi-context |
| nc_l2_read_throughput | Memory read throughput for non coherent global read requests seen at L2 cache | Multi-context |
| nc_l2_read_transactions | Memory read transactions seen at L2 cache for non coherent global read requests | Multi-context |
| shared_efficiency | Ratio of requested shared memory throughput to required shared memory throughput expressed as percentage | Multi-context |
| shared_load_throughput | Shared memory load throughput | Multi-context |
| shared_load_transactions | Number of shared memory load transactions | Multi-context |
| shared_load_transactions_per_request | Average number of shared memory load transactions performed for each shared memory load | Multi-context |
| shared_replay_overhead | Average number of replays due to shared memory conflicts for each instruction executed | Multi-context |
| shared_store_throughput | Shared memory store throughput | Multi-context |
| shared_store_transactions | Number of shared memory store transactions | Multi-context |
| shared_store_transactions_per_request | Average number of shared memory store transactions performed for each shared memory store | Multi-context |
| sm_efficiency | The percentage of time at least one warp is active on a multiprocessor averaged over all multiprocessors on the GPU | Multi-context |
| sm_efficiency_instance | The percentage of time at least one warp is active on a specific multiprocessor | Multi-context |
| stall_constant_memory_dependency | Percentage of stalls occurring because of immediate constant cache miss. This is available for compute capability 3.2 and 3.5. | Multi-context |
| stall_exec_dependency | Percentage of stalls occurring because an input required by the instruction is not yet available | Multi-context |
| stall_inst_fetch | Percentage of stalls occurring because the next assembly instruction has not yet been fetched | Multi-context |
| stall_memory_dependency | Percentage of stalls occurring because a memory operation cannot be performed due to the required resources not being available or fully utilized, or because too many requests of a given type are outstanding. | Multi-context |
| stall_memory_throttle | Percentage of stalls occurring because of memory throttle. | Multi-context |
| stall_not_selected | Percentage of stalls occurring because warp was not selected. | Multi-context |
| stall_other | Percentage of stalls occurring due to miscellaneous reasons | Multi-context |
| stall_pipe_busy | Percentage of stalls occurring because a compute operation cannot be performed due to the required resources not being available. This is available for compute capability 3.2 and 3.5. | Multi-context |
| stall_sync | Percentage of stalls occurring because the warp is blocked at a __syncthreads() call | Multi-context |
| stall_texture | Percentage of stalls occurring because the texture sub-system is fully utilized or has too many outstanding requests | Multi-context |
| sysmem_read_throughput | System memory read throughput. This is available for compute capability 3.0 and 3.5. | Multi-context |
| sysmem_read_transactions | System memory read transactions. This is available for compute capability 3.0 and 3.5. | Multi-context |
| sysmem_utilization | The utilization level of the system memory relative to the peak utilization on a scale of 0 to 10. This is available for compute capability 3.0 and 3.5. | Multi-context |
| sysmem_write_throughput | System memory write throughput. This is available for compute capability 3.0 and 3.5. | Multi-context |
| sysmem_write_transactions | System memory write transactions. This is available for compute capability 3.0 and 3.5. | Multi-context |
| tex_cache_hit_rate | Texture cache hit rate | Multi-context |
| tex_cache_throughput | Texture cache throughput | Multi-context |
| tex_cache_transactions | Texture cache read transactions | Multi-context |
| tex_fu_utilization | The utilization level of the multiprocessor function units that execute texture instructions on a scale of 0 to 10 | Multi-context |
| tex_utilization | The utilization level of the texture cache relative to the peak utilization on a scale of 0 to 10 | Multi-context |
| warp_execution_efficiency | Ratio of the average active threads per warp to the maximum number of threads per warp supported on a multiprocessor expressed as percentage | Multi-context |
| warp_nonpred_execution_efficiency | Ratio of the average active threads per warp executing non-predicated instructions to the maximum number of threads per warp supported on a multiprocessor expressed as percentage | Multi-context |
Devices with compute capability greater than or equal to 5.0 implement the metrics shown in the following table. The multi-context scope is supported for devices with compute capability 5.0..
| Metric Name | Description | Scope |
|---|---|---|
| achieved_occupancy | Ratio of the average active warps per active cycle to the maximum number of warps supported on a multiprocessor | Multi-context |
| atomic_transactions | Global memory atomic and reduction transactions | Multi-context |
| atomic_transactions_per_request | Average number of global memory atomic and reduction transactions performed for each atomic and reduction instruction | Multi-context |
| branch_efficiency | Ratio of non-divergent branches to total branches expressed as percentage | Multi-context |
| cf_executed | Number of executed control-flow instructions | Multi-context |
| cf_fu_utilization | The utilization level of the multiprocessor function units that execute control-flow instructions on a scale of 0 to 10 | Multi-context |
| cf_issued | Number of issued control-flow instructions | Multi-context |
| double_precision_fu_utilization | The utilization level of the multiprocessor function units that execute double-precision floating-point instructions and integer instructions on a scale of 0 to 10 | Multi-context |
| dram_read_throughput | Device memory read throughput | Single-context |
| dram_read_transactions | Device memory read transactions | Single-context |
| dram_utilization | The utilization level of the device memory relative to the peak utilization on a scale of 0 to 10 | Single-context |
| dram_write_throughput | Device memory write throughput | Single-context |
| dram_write_transactions | Device memory write transactions | Single-context |
| ecc_throughput | ECC throughput from L2 to DRAM | Single-context |
| ecc_transactions | Number of ECC transactions between L2 and DRAM | Single-context |
| eligible_warps_per_cycle | Average number of warps that are eligible to issue per active cycle | Multi-context |
| flop_count_dp | Number of double-precision floating-point operations executed by non-predicated threads (add, multiply, multiply-accumulate and special). Each multiply-accumulate operation contributes 2 to the count. | Multi-context |
| flop_count_dp_add | Number of double-precision floating-point add operations executed by non-predicated threads | Multi-context |
| flop_count_dp_fma | Number of double-precision floating-point multiply-accumulate operations executed by non-predicated threads. Each multiply-accumulate operation contributes 1 to the count. | Multi-context |
| flop_count_dp_mul | Number of double-precision floating-point multiply operations executed by non-predicated threads | Multi-context |
| flop_count_sp | Number of single-precision floating-point operations executed by non-predicated threads (add, multiply, multiply-accumulate and special). Each multiply-accumulate operation contributes 2 to the count. | Multi-context |
| flop_count_sp_add | Number of single-precision floating-point add operations executed by non-predicated threads | Multi-context |
| flop_count_sp_fma | Number of single-precision floating-point multiply-accumulate operations executed by non-predicated threads. Each multiply-accumulate operation contributes 1 to the count. | Multi-context |
| flop_count_sp_mul | Number of single-precision floating-point multiply operations executed by non-predicated threads | Multi-context |
| flop_count_sp_special | Number of single-precision floating-point special operations executed by non-predicated threads | Multi-context |
| flop_dp_efficiency | Ratio of achieved to peak double-precision floating-point operations | Multi-context |
| flop_sp_efficiency | Ratio of achieved to peak single-precision floating-point operations | Multi-context |
| gld_efficiency | Ratio of requested global memory load throughput to required global memory load throughput expressed as percentage | Single-context |
| gld_requested_throughput | Requested global memory load throughput | Multi-context |
| gld_throughput | Global memory load throughput | Single-context |
| gld_transactions | Number of global memory load transactions | Single-context |
| gld_transactions_per_request | Average number of global memory load transactions performed for each global memory load | Single-context |
| global_hit_rate | Hit rate for global loads | Single-context |
| gst_efficiency | Ratio of requested global memory store throughput to required global memory store throughput expressed as percentage | Single-context |
| gst_requested_throughput | Requested global memory store throughput | Multi-context |
| gst_throughput | Global memory store throughput | Single-context |
| gst_transactions | Number of global memory store transactions | Single-context |
| gst_transactions_per_request | Average number of global memory store transactions performed for each global memory store | Single-context |
| inst_bit_convert | Number of bit-conversion instructions executed by non-predicated threads | Multi-context |
| inst_compute_ld_st | Number of compute load/store instructions executed by non-predicated threads | Multi-context |
| inst_control | Number of control-flow instructions executed by non-predicated threads (jump, branch, etc.) | Multi-context |
| inst_executed | The number of instructions executed | Multi-context |
| inst_fp_32 | Number of single-precision floating-point instructions executed by non-predicated threads (arithmetric, compare, etc.) | Multi-context |
| inst_fp_64 | Number of double-precision floating-point instructions executed by non-predicated threads (arithmetric, compare, etc.) | Multi-context |
| inst_integer | Number of integer instructions executed by non-predicated threads | Multi-context |
| inst_inter_thread_communication | Number of inter-thread communication instructions executed by non-predicated threads | Multi-context |
| inst_issued | The number of instructions issued | Multi-context |
| inst_misc | Number of miscellaneous instructions executed by non-predicated threads | Multi-context |
| inst_per_warp | Average number of instructions executed by each warp | Multi-context |
| inst_replay_overhead | Average number of replays for each instruction executed | Multi-context |
| ipc | Instructions executed per cycle | Multi-context |
| issue_slot_utilization | Percentage of issue slots that issued at least one instruction, averaged across all cycles | Multi-context |
| issue_slots | The number of issue slots used | Multi-context |
| issued_ipc | Instructions issued per cycle | Multi-context |
| l2_atomic_throughput | Memory read throughput seen at L2 cache for atomic and reduction requests | Multi-context |
| l2_atomic_transactions | Memory read transactions seen at L2 cache for atomic and reduction requests | Single-context |
| l2_read_throughput | Memory read throughput seen at L2 cache for all read requests | Single-context |
| l2_read_transactions | Memory read transactions seen at L2 cache for all read requests | Single-context |
| l2_tex_read_hit_rate | Hit rate at L2 cache for all read requests from texture cache | Single-context |
| l2_tex_read_throughput | Memory read throughput seen at L2 cache for read requests from the texture cache | Sinlge-context |
| l2_tex_read_transactions | Memory read transactions seen at L2 cache for read requests from the texture cache | Single-context |
| l2_tex_write_hit_rate | Hit Rate at L2 cache for all write requests from texture cache | Single-context |
| l2_tex_write_throughput | Memory write throughput seen at L2 cache for write requests from the texture cache | Sinlge-context |
| l2_tex_write_transactions | Memory write transactions seen at L2 cache for write requests from the texture cache | Single-context |
| l2_utilization | The utilization level of the L2 cache relative to the peak utilization on a scale of 0 to 10 | Single-context |
| l2_write_throughput | Memory write throughput seen at L2 cache for all write requests | Single-context |
| l2_write_transactions | Memory write transactions seen at L2 cache for all write requests | Single-context |
| ldst_executed | Number of executed load and store instructions | Multi-context |
| ldst_fu_utilization | The utilization level of the multiprocessor function units that execute global, local and shared memory instructions on a scale of 0 to 10 | Multi-context |
| ldst_issued | Number of issued load and store instructions | Multi-context |
| local_hit_rate | Hit rate for local loads and stores | Single-context |
| local_load_throughput | Local memory load throughput | Single-context |
| local_load_transactions | Number of local memory load transactions | Single-context |
| local_load_transactions_per_request | Average number of local memory load transactions performed for each local memory load | Single-context |
| local_memory_overhead | Ratio of local memory traffic to total memory traffic between the L1 and L2 caches expressed as percentage | Single-context |
| local_store_throughput | Local memory store throughput | Single-context |
| local_store_transactions | Number of local memory store transactions | Single-context |
| local_store_transactions_per_request | Average number of local memory store transactions performed for each local memory store | Single-context |
| shared_efficiency | Ratio of requested shared memory throughput to required shared memory throughput expressed as percentage | Single-context |
| shared_load_throughput | Shared memory load throughput | Single-context |
| shared_load_transactions | Number of shared memory load transactions | Single-context |
| shared_load_transactions_per_request | Average number of shared memory load transactions performed for each shared memory load | Single-context |
| shared_store_throughput | Shared memory store throughput | Single-context |
| shared_store_transactions | Number of shared memory store transactions | Single-context |
| shared_store_transactions_per_request | Average number of shared memory store transactions performed for each shared memory store | Single-context |
| shared_utilization | The utilization level of the shared memory relative to peak utilization on a scale of 0 to 10 | Single-context |
| single_precision_fu_utilization | The utilization level of the multiprocessor function units that execute single-precision floating-point instructions and integer instructions on a scale of 0 to 10 | Multi-context |
| sm_efficiency | The percentage of time at least one warp is active on a multiprocessor | Single-context |
| special_fu_utilization | The utilization level of the multiprocessor function units that execute sin, cos, ex2, popc, flo, and similar instructions on a scale of 0 to 10 | Multi-context |
| stall_constant_memory_dependency | Percentage of stalls occurring because of immediate constant cache miss | Multi-context |
| stall_exec_dependency | Percentage of stalls occurring because an input required by the instruction is not yet available | Multi-context |
| stall_inst_fetch | Percentage of stalls occurring because the next assembly instruction has not yet been fetched | Multi-context |
| stall_memory_dependency | Percentage of stalls occurring because a memory operation cannot be performed due to the required resources not being available or fully utilized, or because too many requests of a given type are outstanding | Multi-context |
| stall_memory_throttle | Percentage of stalls occurring because of memory throttle | Multi-context |
| stall_not_selected | Percentage of stalls occurring because warp was not selected | Multi-context |
| stall_other | Percentage of stalls occurring due to miscellaneous reasons | Multi-context |
| stall_pipe_busy | Percentage of stalls occurring because a compute operation cannot be performed due to the required resources not being available | Multi-context |
| stall_sync | Percentage of stalls occurring because the warp is blocked at a __syncthreads() call | Multi-context |
| stall_texture | Percentage of stalls occurring because the texture sub-system is fully utilized or has too many outstanding requests | Multi-context |
| sysmem_read_throughput | System memory read throughput | Single-context |
| sysmem_read_transactions | System memory read transactions | Single-context |
| sysmem_utilization | The utilization level of the system memory relative to the peak utilization on a scale of 0 to 10 | Single-context |
| sysmem_write_throughput | System memory write throughput | Single-context |
| sysmem_write_transactions | System memory write transactions | Single-context |
| tex_cache_hit_rate | Texture cache hit rate | Single-context |
| tex_cache_throughput | Texture cache throughput | Single-context |
| tex_cache_transactions | Texture cache read transactions | Single-context |
| tex_fu_utilization | The utilization level of the multiprocessor function units that execute texture instructions on a scale of 0 to 10 | Multi-context |
| tex_utilization | The utilization level of the texture cache relative to the peak utilization on a scale of 0 to 10 | Single-context |
| warp_execution_efficiency | Ratio of the average active threads per warp to the maximum number of threads per warp supported on a multiprocessor expressed as percentage | Multi-context |
| warp_nonpred_execution_efficiency | Ratio of the average active threads per warp executing non-predicated instructions to the maximum number of threads per warp supported on a multiprocessor | Multi-context |
10. Profiler Known Issues
- To ensure that all profile data is collected and flushed to a file, cudaDeviceSynchronize() followed by either cudaDeviceReset() or cudaProfilerStop() should be called before the application exits. Refer the section Flush Profile Data.
- Concurrent kernel mode can add significant overhead if used on kernels that execute a large number of blocks and that have short execution durations.
- If the kernel launch rate is very high, the device memory used to collect profiling data can run out. In such a case some profiling data might be dropped. This will be indicated by a warning.
- When profiling an application that uses Dynamic Parallelism
there are several limitations to the profiling tools.
- The Visual Profiler timeline does not display CUDA API calls invoked from within device-launched kernels.
- The Visual Profiler does not display detailed event, metric, and source-level results for device-launched kernels. Event, metric, and source-level results collected for CPU-launched kernels will include event, metric, and source-level results for the entire call-tree of kernels launched from within that kernel.
- The nvprof event/metric output and the command-line profiler event output does not include results for device-launched kernels. Events/metrics collected for CPU-launched kernels will include events/metrics for the entire call-tree of kernels launched from within that kernel.
- Profiling APK binaries is not supported.
- Visual Profiler is not supported on the ARM architecture. You can use Remote Profiling. Refer the Remote Profiling section for more information.
- Unified memory profiling counters are not supported on the ARM architecture.
- The following are known issues related to Visual Profiler:
- Some analysis results require metrics that are not available on all devices. When these analyses are attempted on a device where the metric is not available the analysis results will show that the required data is "not available".
- Note that "Examine stall reasons" analysis does not work for compute capability 3.0. But in this case no results or message is displayed and so it can be confusing.
- Visual Profiler cannot directly profile a application which is launched from another script. One possible workaround can be to use the nvprof --profile-child-processes option and then import the generated data in Visual Profiler.
- Using the mouse wheel button to scroll does not work within the Visual Profiler on Windows.
- Since Visual Profiler uses nvprof for collecting profiling data, nvprof limitations also apply to Visual Profiler.
- The Visual Profiler cannot correctly import profiler data generated by nvprof when the option --kernels kernel-filter is used. Visual Profiler reports a warning, "Some collected events or source-level results could not be associated with the session timeline." One workaround is to use the nvprof option --kernels :::1 to profile the first invocation for all kernels.
- Visual Profiler cannot load profiler data larger than the memory size limited by JVM or available memory on the system. Refer Improve Loading of Large Profiles for more information.
- The following are known issues related to nvprof:
- nvprof cannot profile processes that fork() but do not then exec().
- nvprof assumes it has access to the temporary directory on the system, which it uses to store temporary profiling data. On Linux/Mac the default is /tmp. On Windows it's specified by the system environment variables. To specify a custom location, change $TMPDIR on Linux/Mac or %TMP% on Windows.
- To profile application on Android $TMPDIR environment variable has to be defined and point to a user-writable folder.
- Profiling results might be inconsistent when auto boost is enabled. nvprof tries to disable auto boost by default, it might fail to do so in some conditions, but profiling will continue. nvprof will report a warning when auto boost cannot be disabled. Note that auto boost is supported only on certain Tesla devices from the Kepler+ family.
- The following are known issues related to Events and Metrics:
- In event or metric profiling, kernel launches are blocking. Thus kernels waiting on host updates may hang.
- For some metrics, the required events can only be collected for a single CUDA context. For an application that uses multiple CUDA contexts, these metrics will only be collected for one of the contexts. The metrics that can be collected only for a single CUDA context are indicated in the metric reference tables.
- Some metric values are calculated assuming a kernel is large enough to occupy all device multiprocessors with approximately the same amount of work. If a kernel launch does not have this characteristic, then those metric values may not be accurate.
- Some metrics are not available on all devices. To see a list of all available metrics on a particular NVIDIA GPU, type nvprof --query-metrics. You can also refer to the metric reference tables.
- For compute capability 2.x devices, the achieved_occupancy metric can report inaccurate values that are greater than the actual achieved occupancy. In rare cases this can cause the achieved occupancy value to exceed the theoretical occupancy value for the kernel.
- The profilers may fail to collect events or metrics when "application replay" mode is turned on. This is most likely to happen if the application is multi-threaded and non-deterministic. Instead use "kernel replay" mode in this case.
- Here are a couple of reasons why Visual Profiler
may fail to gather metric or event information.
- More than one tool is trying to access the GPU. To fix this issue please make sure only one tool is using the GPU at any given point. Tools include the CUDA command line profiler, Parallel NSight Analysis Tools and Graphics Tools, and applications that use either CUPTI or PerfKit API (NVPM) to read event values.
- More than one application is using the GPU at the same time Visual Profiler is profiling a CUDA application. To fix this issue please close all applications and just run the one with Visual Profiler. Interacting with the active desktop should be avoided while the application is generating event information. Please note that for some types of event Visual Profiler gathers events for only one context if the application is using multiple contexts within the same application.
- When collecting events or metrics with the --events, --metrics, or --analysis-metrics options, nvprof will use kernel replay to execute each kernel multiple times as needed to collect all the requested data. If a large number of events or metrics are requested then a large number of replays may be required, resulting in a significant increase in application execution time.
- Profiler events and metrics do not work correctly on OS X 10.8.5 and OS X 10.9.3. OS X 10.9.2 or OS X 10.9.4 or later can be used.
- Some events are not available on all devices. To see a list of all available events on a particular device, type nvprof --query-events.
- Enabling certain events can cause GPU kernels to run
longer than the driver's watchdog time-out limit. In these
cases the driver will terminate the GPU kernel resulting in
an application error and profiling data will not be available.
Please disable the driver watchdog time out before profiling
such long running CUDA kernels.
- On Linux, setting the X Config option Interactive to false is recommended.
- For Windows, detailed information on disabling the Windows TDR is available at http://msdn.microsoft.com/en-us/windows/hardware/gg487368.aspx#E2
Notices
Notice
ALL NVIDIA DESIGN SPECIFICATIONS, REFERENCE BOARDS, FILES, DRAWINGS, DIAGNOSTICS, LISTS, AND OTHER DOCUMENTS (TOGETHER AND SEPARATELY, "MATERIALS") ARE BEING PROVIDED "AS IS." NVIDIA MAKES NO WARRANTIES, EXPRESSED, IMPLIED, STATUTORY, OR OTHERWISE WITH RESPECT TO THE MATERIALS, AND EXPRESSLY DISCLAIMS ALL IMPLIED WARRANTIES OF NONINFRINGEMENT, MERCHANTABILITY, AND FITNESS FOR A PARTICULAR PURPOSE.
Information furnished is believed to be accurate and reliable. However, NVIDIA Corporation assumes no responsibility for the consequences of use of such information or for any infringement of patents or other rights of third parties that may result from its use. No license is granted by implication of otherwise under any patent rights of NVIDIA Corporation. Specifications mentioned in this publication are subject to change without notice. This publication supersedes and replaces all other information previously supplied. NVIDIA Corporation products are not authorized as critical components in life support devices or systems without express written approval of NVIDIA Corporation.