This page summarizes the siting research of Prof W. Randolph Franklin, Rensselaer Polytechnic Institute, Troy NY 12180, (web: http://franklin.org/ ) and colleagues, including Prof Marcus Andrade at the Universidade Federal de Viçosa (MG), Brasil. Much of this research was performed in 2005–2009 as a DARPA/DSO/Geo* project. Since then, work has continued as a small part of various NSF grants, such as IIS-1117277.
The online version of this page is http://wrfranklin.org/pmwiki/Research/Siting .
Algorithms
Our research has produced the following efficient algorithms (with implementations) related to siting observers on a raster (e.g., DEM) terrain.
- Visibility index computation. This determines how good a given observer is, by computing what fraction of a circle of specified radius, centered on the observer, that is visible by that observer.
- Viewshed computation. This computes the exact region of the terrain that a given observer can see.
- Multi-observer siting. For given K, find quasi-optimal sites (or locations) for K observers, to maximize the area of the union of their viewsheds.
- ... with intervisibility. Constrain the multi-observer siting so that the graph of observer – observer visibility is connected. (The vertices of this graph are the observers. There is an edge between two observers if they are in each others' viewsheds.)
- Path planning to avoid the observers, aka the smugglers and border guards problem. Given some terrain, and some observers that have been jointly sited as in item 3 above, and given a source and a goal pixel, determine an optimal path between the source and goal. The cost function has three components, in order from most to least important.
- Try very hard to avoid being seen.
- Minimize uphill travel. (Since downhill travel is free, the cost is not symmetric and so not a metric function.)
- Minimize horizontal distance traveled.
Properties
General properties of all the algorithms are as follows.
- The terrain data structure is a grid of elevation posts or pixels.
- The observer is allowed to be a specified distance above the local terrain, as would be the case for a lighthouse on a reef.
- The targets, whose visibility is desired, are also allowed to be a specified distance above their local terrain, as for lookouts on ships.
- The target must be within a given radius of interest of the observer to be visible.
- The terrain can be hi-res — 3600x3600 pixels is easy to process.
- The radius of interest can be large, easily hundreds of pixel widths. (These last two advantages are not always enjoyed by competing algorithms).
- Since these problems usually take exponential time to optimize perfectly, and since the data has a large error bar in z and a low resolution in (x,y), we use Monte Carlo algorithms and heuristics rather than theoretically optimal algorithms.
- We implement everything and test it on multiple datasets.
- Our code is freely available for non-profit research and development.
Applications of multiobserver siting
This multiple observers case is particularly interesting and complex, and has many applications. A cell phone provider wishes to install multiple towers so that at least one tower is visible (in a radio sense) from every place a customer's cellphone might be. Here, the identities of the observers of highest visibility index are of more interest than their exact visibility indices, or than the visibility indices of all observers. One novel future application of siting radio transmitters will occur when the moon is settled. The moon has no ionosphere to reflect signals, and no stable satellite orbits. The choices for long-range communication would seem to include either a lot of fiber optic cable or many relay towers. That solution is the multiple observer visibility problem.
As another example, a military planner needs to put observers so that there is nowhere to hide that is not visible from at least one. This leads to a corollary application, where the other side's planner may want to analyze the first side's observers to find places to hide. In this case, the problem is to optimize the targets' locations, instead of the observers'.
Again, a planner for a scenic area may consider each place where a tourist might be to be an observer, and then want to locate ugly infrastructure, such as work yards, at relatively hidden sites. We may wish site a forest clearcut to be invisible to observers driving on a highway sited to give a good view. Finally, an architect may be trying to site a new house while following the planning board's instruction that, You can have a view, but you can't be the view.
Speed of execution on large datasets is of more importance than may be apparent. Many prototype implementations, altho demonstrated on small datasets, do not scale up well. Some preliminary published algorithms may even be exponential if performing a naive search. Therefore, we strive for the best time possible.
In addition, large datasets may contain cases, which did not occur in the small test sets, that require tedious special programming by the designer. In a perfect software development process, all such cases would have been theoretically analyzed and treated. However, in the real world, testing on the largest available datasets increases some confidence in the program's correctness.
Next, a large enough quantitative increase in execution speed leads to a qualitative increase in what we can do. Only if visibility can be computed efficiently, can it be used in a subroutine that is called many times, perhaps as as part of a search, to optimize the number of observers. This becomes more important when a more realistic function is being optimized, such as the total cost. E.g., for radio towers, there may be a tradeoff between a few tall and expensive towers, and many short and cheap ones. Alternatively, certain tower locations may be more expensive because of the need to build a road. We may even wish to add redundancy so that every possible target is visible from at least two observers. In all these cases, where a massive search of the solution space is required, success depends on each query being as fast as possible.
Finally, altho the size of available data is growing quickly, it is not necessarily true that available computing power is keeping pace. There is a military need to offload computations to small portable devices, such as a Personal Digital Assistant (PDA). A PDA's computation power is limited by its battery, since, approximately, for a given silicon technology, each elemental computation consumes a fixed amount of energy. Batteries are not getting better very quickly; increasing the processor's cycle speed just runs down the battery faster.
There is also a compounding effect between efficient time and efficient space. Smaller data structures fit into cache better, and so page less, which reduces time. The point of all this is that efficient software is at least as important now as ever.
Our computations are performed on a full resolution cell. That is, on a 1201x1201 cell, the visibility indices of all 1.4M points are estimated. For each tentative observer, as accurate a viewshed as possible is computed. This point is important since some other systems appear to compute low-resolution approximations to viewsheds.
Our system scales up well. Elevations cells of resolution over 2000x2000 are no problem.
Viewshed examples
The sample cell used here is the USGS level-1 Lake Champlain West DEM. It has elevations ranging from the highest point in New York State, down to a large lake only 200 ft above sea level. Here is the cell (the image is scaled down by half to fit the display). North is to the right. The shading was done with Povray.

Lake Champlain West DEM
This test uses a radius of interest of 100 postings, and an observer and target height of 30 meters.
The time on a dual Xeon to site the observers was about 2 minutes. Actually, I do most computations on my laptop.
These images are a montage of some of the viewsheds of tentative observers. Observe the level of detail. Compare this to the viewsheds as determined by other systems.

Viewshed montage
Since the montage images may be scaled down, here is one viewshed at double full resolution, to show the detail.

Viewshed at full resolution
Successively Adding Observers, with Intervisibility
The following is a montage of the increasing visible area in the cell as more and more observers are sited. To save space, we generally show a new image only after 3 new observers.
We added a new constraint: each new observer must be visible to at least one observer that has already been added. Therefore all the observers can communicate with line-of-sight radio.
The images also have black dots for the observer positions, perimeter circles at a distance of the ROI from each included observer, and heavy black lines joining each pair of visible observers.
Following that is one cumulative viewshed at its original resolution.
Finally, here is a video showing the observers being added. The black areas are not visible from any observer. As more observers are added, the remaining hidden patches tend to be small and well separated.


Efficiency
The system is very fast (a few minutes for a level 1 DEM). Indeed generating the images took several times longer than siting the observers.
The system takes advantage of multiple processors. On a dual processor Xeon system with hyperthreading, 4-way parallelism is used for most of the computations (altho a hyperthreaded processor runs only about 30% faster than a non-hyperthreaded one.)
Efficiency is more important than some people realize. A sufficient quantitative improvement in speed leads to a qualitative change in what can be done. More experiments become possible. The efficient system can become a base on which to build new, higher level, tools.
Application to terrain compression
Evaluating our lossy terrain compression algorithms is one of our major siting applications. Assume that original terrain, {$ {\cal T}_0$} is lossily compressed then reconstructed to give terrain {$ {\cal T}_1$}.
The obvious compression criterion is to measure the RMS elevation error in {$ {\cal T}_1$} compared to {$ {\cal T}_0$}. However that is naive.
We used siting, by siting observers, on both {$ {\cal T}_0$} and {$ {\cal T}_1$}. However, comparing the two sets of locations is wrong. The problem is that two quite different sets of locations might be equally good; they might have the same joint viewshed.
It would also be wrong to evaluate, on {$ {\cal T}_1$}, sitings and paths computed on {$ {\cal T}_1$}. A malicious compression program might output a completely wrong terrain, so that anything computed on it is meaningless. But, how would we know that such a result is meaningless? We did the following to evaluate the terrain compression.
- On {$ {\cal T}_0$}, solve the multiple observer siting problem, with solution set {$ {\cal S}_0$} and cost {$c_0$}.
- On {$ {\cal T}_1$}, solve the multiple observer siting problem, with solution set {$ {\cal S}_1$} and cost {$c_1$}.
- Transfer {$ {\cal S}_1$} to {$ {\cal T}_0$} and compute its cost, {$c_{1\rightarrow0} $}.
- Compare {$c_{1\rightarrow0} $} to {$c_0$}; if the former is not much larger than the latter, then {$ {\cal T}_1$} is a good approximation to {$ {\cal T}_0$}.
- Paths can also be used, instead of observer sites, to evaluate the terrain, as the following figure shows.
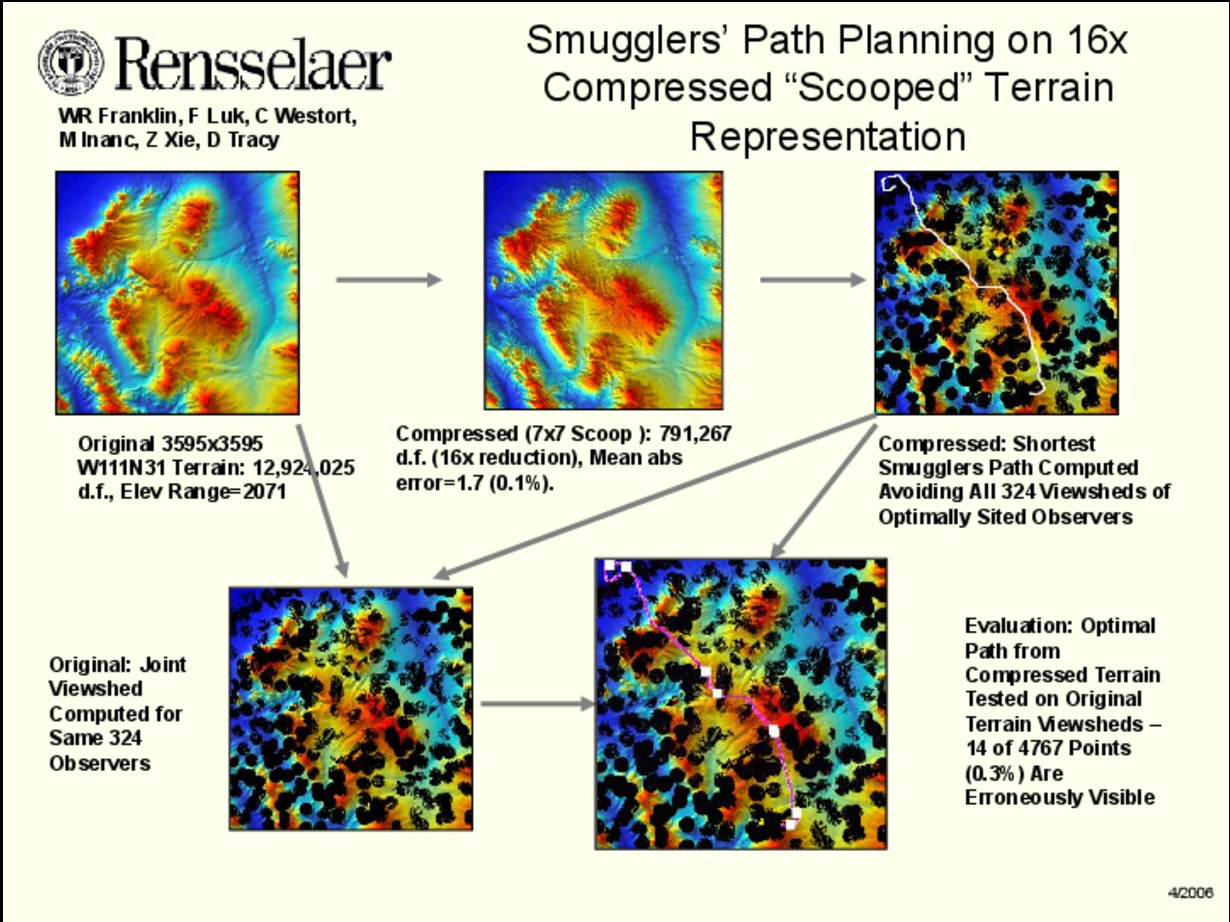
Smugglers’ Path Planning on 16x Compressed “Scooped” Terrain Representation
Surprising results
- Even for single observer siting, there can be little correlation between observer elevation and visibility index.
- Viewsheds can have remarkably large error bars. In one experiment, the visibility of one half of all the pixels in a cell varied depending on how terrain elevation was interpolated between two adjacent posts. That is a necessary operation because lines of sight usually run between posts.
Open research questions
- Precision of the results. Study this in more detail. The big input is the limited information about the terrain. That is one motivation for my long-term project on Mathematics of Terrain. Perhaps statistical techniques like resampling might be of some use.
- Application of limited precision to making the algorithm faster. Since viewsheds and visibility indexes are imprecise, there may be faster algorithms whose outputs are just as good. (The obsolete engineering analogy is to hand-calculate using only the necessary number of significant digits.)
- Dynamic input. Smugglers and border guards is a two ply game. A possible third ply by the guards would be to add observers to cut off long smugglers' paths rather than merely to maximize joint viewshed. In turbulent regions of the world, a possible fourth ply, by the smugglers, would be to attempt to delete some guards.
Publications and talks
The online version of this page contains links to most of the papers, and to any posters and talk slides.
- bibtexsummary:[/wrf.bib,magalhaes-ijcisim-2011]
- bibtexsummary:[/wrf.bib,magalhaes-his-2010]
- bibtexsummary:[/wrf.bib,andrade-geoinfo-ext-viewshed-2008]
- bibtexsummary:[/wrf.bib,tracy-acmgis-2008]
- bibtexsummary:[/wrf.bib,wrf-fwcg-2008]
- bibtexsummary:[/wrf.bib,tracy-fwcg-2008]
- bibtexsummary:[/wrf.bib,dt-wrf-spie-2007]
- bibtexsummary:[/wrf.bib,acmgis07]
- bibtexsummary:[/wrf.bib,unigis-2006] This summarizes RPI's role in the GeoStar project as of 2006.
- bibtexsummary:[/wrf.bib,wrf-sdh2006]
- bibtexsummary:[/wrf.bib,wrf-cv-siting-isprs]
- bibtexsummary:[/wrf.bib,wrf-siting-apr2004]
- bibtexsummary:[/wrf.bib,wrf-site]
- bibtexsummary:[/wrf.bib,fr-hinbv-94]
- bibtexsummary:[/wrf.bib,wrf-savannah]
Software
A testbed consisting of a sequence of interacting programs has been produced. To learn about it, read here:
- sections 1 and 2 of the SDH2002 paper, linked above.
If those are not satisfactory, then read here:
- section 2 of the unpublished GIScience 2004 paper
- the ISPRS 2004 poster
- sections 2 and 3 of the ISPRS 2004 paper
The source code, makefiles and sample data are here: http://wrfranklin.org/wiki/Main/siting/site.tgz. My development environment is linux and c++.
The source code, plus executables and sample computed viewsheds and images are in this 126MB tarball: http://wrfranklin.org/wiki/Main/siting/site-big.tgz.
About this page
- This web page was intended to display with most HTML renderers on hardware ranging from a hi-res laptop to a lo-res smart phone, and to look good when printed. Please report lapses.
- This page is an update and rewrite of various earlier pages, such as MultiobserverSiting and https://wrf.ecse.rpi.edu/Research/siting/