
Disclaimer:
"Where we stand depends on where we sit."
I've designed and implemented algorithms for geographers for a few decades, but my prime background is CS, math, and physics.
Note: This file is formatted to be displayed in fullscreen mode by Opera, zoomed to 200%. Each <h1> starts a new screen.
things we know that aren't true
things that now are true
vision for future research in computational and geometric cartography.
(CS = crop computer science)
"It's not what they don't know that's so important, but what they know that isn't so." - Will Rogers
CS changes quickly.
Efficiency (in time or space) doesn't matter anymore.
Increase in computing power is keeping pace with increase in data.
The data structures taught in intro CS classes are appropriate for production SW.
Higher observers are more visible than lower ones.
\begin{oldfartmode}
Little in the required sophomore intro computer engineering course I'm now teaching has changed in 20 years (except SW tools and textbook).
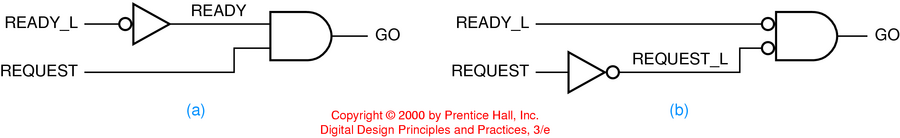
- Boolean algebra, logic minimization, medium-scale integrated circuits, arithmetic-logic unit principles, flip/flops, combinational logic, sequential logic...
WIMP (windows, icons, mouse, pointer) interface? The Xerox Alto computer is 30 years old. It "was the first fully networked personal computer--complete with bit mapping, a mouse, and ethernet networking capability." It was developed at Xerox PARC.

Object-oriented languages date from 1970s.
Machines don't boot any faster.
The above old ideas, which were only in the research labs, are now universally deployed.
Speeds, capacities.
Underlying HW technologies (but hidden from user).
Most commercial SW vendors seem to believe this.
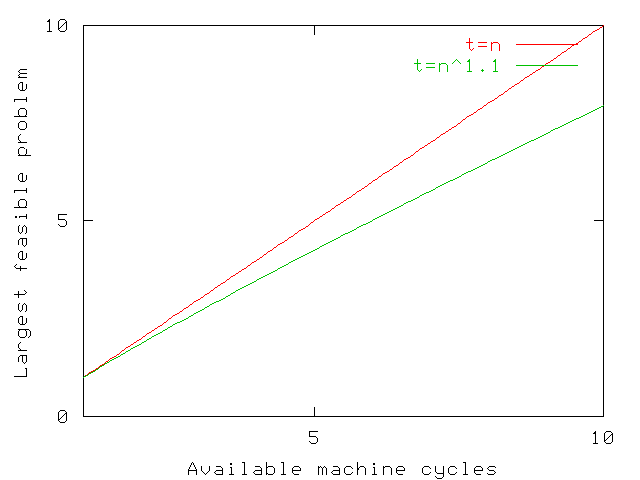
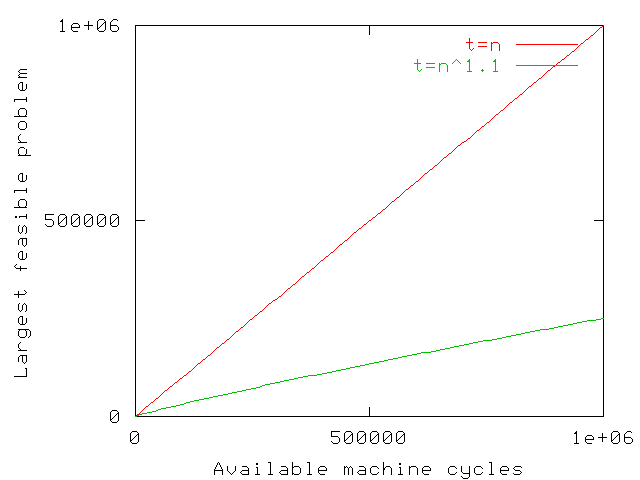
Machines get faster ⇒
Largest feasible problem size gets bigger ⇒
We go further out on the execution time asymptotic curves.
Compact data structures are as important as ever.
Machine storage has several levels:
Every time the CPU is forced to access a larger and slower level, access times increase dramatically.
  for(i=0; i< n; i++) a[i] = i;
  for(i=0; i<n; i++) s+= (double) a[i];
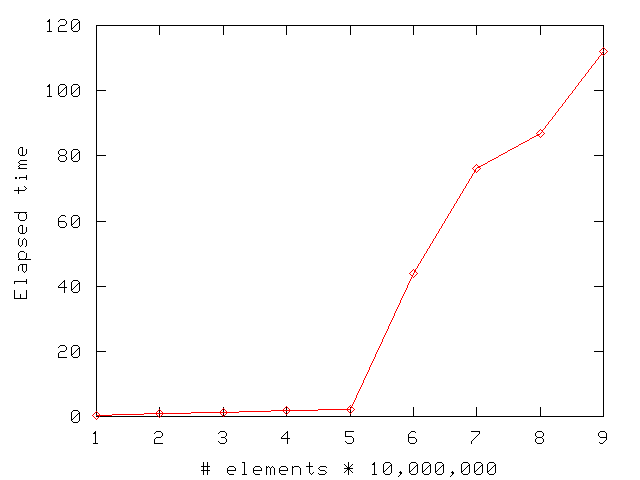
Suddenly this program got 15 times slower!
Guess how much memory this machine has?
Certainly not true for PDAs, since batteries aren't getting much better.
An elementary computation uses a fixed amount of energy (for fixed technology etc)
∴ faster CPU ⇒ more power consumption.
New data: SAR, LIDAR, ...
Statistically: too much data, not too little.
The history of statistics is the most efficient estimation of properties from too little data.
Now, we decide how to cull -- in real time -- the data stream.
Often the best (or a good enough) solution is simple
Hashing:
Q: Where to insert record number K into a table of M elements?
A: At location mod(K,M).
Bin packing:
Q: How to store a group of objects of varying sizes in the smallest number of bins?
A: First fit decreasing.
Virtual memory:
Q: What page to page out to make room for a new page?
A: Least recently used.
Each of the above obvious answers is the result of considerable research.
Open theoretical issue: why some simple algorithms, with intolerable worst-case times, work so well in practice. E.g., edge segment intersection and visible surface determination via uniform grid.
in practice?? Unfairly optimistic to assume the data to be uniform and uncorrelated, but unfairly pessimistic to make no assumptions at all. Most analytical cartography implementations that everyone uses every day can be made to fail by an adversary who selects the worst possible input.
Some are directly relevant, some just too interesting to ignore.
rdist: Efficient synchronization of two sets of files
at opposite ends of a link that is both slow and has a large
latency.
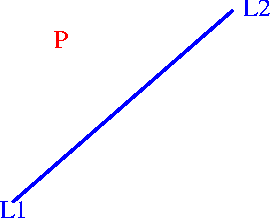
CGAL, LEDA: C++ template libs.
rational expressions (1/2 + 3/5 = 11/10) etc. Can intersect two lines exactly.
access to standard geometric, CS, algorithms, data structures.
Chee Yap: Exact Geometric Computation template lib performs computations to just sufficient precision to make evaluate the sign of a determinant.
Faster drainage calculation on large datasets ( Toma, Wickremesinghe, Arge et al)
Fitting 3D surfaces of complex topology to point clouds ( Dey, Amenta - see below).
New Algorithm Philosophy
The program flips coins while executing.
Exec time varies even on the same input, but average is good.
There are now no input cases that take excessively long.
Output is exact.
Contrast to Monte Carlo randomization, where output is approximate.
Apps include: quick sort, linear programming.
Goal: sort these numbers: 3, 1, 4, 5, 9, 2, 6.
Method:
Performance:
Las Vegas solution to quicksort:
Las Vegas algorithms are fast (but that is hard to prove) and simple to implement.
Many earlier algorithms were easy to analyze but hard to implement. That's progress.
Major Research Question
What's the problem?
Many of us, myself included have been representing terrain with TINs, grids, etc, for decades.
Have we failed so far to do it right?
Yes.
We could formally ask about the best algorithms for
compression,
visibility
mobility
multi-source data conflation
Instead of just trying heuristics on test samples.
It was initially intuitive.
Eventually paradoxes and problems appeared, like continuous, yet nowhere differentiable functions.
Analysis had to be invented to resolve this.
Real terrain is more irregular than databases such as DEM-1 cells.
Not differentiable many times (or at all).
Maybe not continuous (cliffs).
Complex, long range, continent-wide, correlations (river basins).
Not symmetric: rivers' headwaters are often near one edge of the continent.
Scale variance (rock has finite strength).
Heterogeneity...
Many local maxima; few local minima (above sea level). -- lakes. (more local mins in Colorado this summer)
Nevertheless, 2D sampled data sets will have local minima, even if the data is exact.
Earth terrain (water erosion) is different from lunar terrain (impact craters).
Fourier series
Wavelets
Fractals
f(x) = bo + ∑i=1∞ ai sin ix + bi cos ix

Good for electrical signals.
The physics matches the math.
Physical media are generally linear.
Truncating a series representing a signal produces another legal signal, the low-pass filter of the original.
Can't represent discontinuities (but signals aren't discontinuous).
However, Fourier series are quite unsuitable for terrain.
Terrain's processes are not linear.
A truncated series is not real terrain.
Too continuous.
Too many local minina.
Also a linear combo of a basis set.
Local support - changing one coefficient changes only a local region (good).
Can represent discontinuities (depending on basis set) (good).
Truncating series still produces illegal terrain (bad).
Basic fractals are quite unrealistic.
Sufficient extras (heterogeneity, erosion, ...) do help, but...
Enough degrees of freedom can make (almost) any representation work.
Ptolemaic epicycles were as accurate as Keplerian ellipses.
However... what's natural?
This is the major problem, and opportunity, in Computational and Geometric Cartography.
Traditional, linear, geostatistical models such as kriging do not capture this complexity.
Data structures and operations like compression that ignore this will be suboptimal, and often erroneous.
We lose the ability to form a linear combination of a set of basis functions, which is a powerful mathematical tool.
Another hard problem.
There may be several correlated layers of data for the same surface.
E.g.: elevation and slope.
Slope is needed for soil erosion, helicopter landings.
Q: Why store slope explicitly?
A: Computating from elevations is error-prone, especially if elevations are inaccurate.
If each layer is compressed separately, they become mutually inconsistent.
That's worse than being inaccurate.
These are from a commercial mapping product.
Users of commercial GIS packages might think that these problems are natural.
My guess is that elevations were stored as a grid, lossily compressed, and then contours were re-interpolated on demand.
The same data may be available
|
E.g., elevations from...
|
Combine them, to create one layer, plus error bars.
The right way is to find a maximum likelihood estimator, but that requires a probability distribution.
The proper data representation can make difficult problems vanish.
E.g., we want to interpolate contour lines thru some data.
The obvious method is to trace each contour line thru the grid cells, independently of its neighboring contours.
However, the distance between the lines is not smooth. The lines might even cross.
Solution:
Interpolate a surface from the data.
Then trace the contour lines on it.
Important operation, given increasing data.
Not yet true that storage is big and cheap enough.
Earth at 1 meter resolution: 5x10¹⁶ posts.
PDAs have severely restricted power and resource bounds
Lossy compression is probably fine.
Error Metric:
RMSE too simplistic.
Rather: effect of errors on derived properties, such as visibility.
User quality metrics are nonlinear.
Simple metric is RMS error.
Too simple for terrain.
Preserving features like gullies is more important than maintaining exact elevations.
Because real terrain, except for karst territory and deserts, has few local minima, the stored terrain shouldn't...
...IF we ignore sampling
How much can each possible observer see?
| 
|
Future visibility application.
Assume two points on the moon's surface want to communicate.
No ionosphere to reflect radio.
No stable satellite orbits.
Obvious solutions:
Fiber, or relay towers
Also relevant to Mars, which has a weak ionosphere.
What, specifically, can a particular observer see?

Small changes in the input cause large changes in the input.
The previous beautiful image is partly (mostly?) fiction.
However certain regions are definitely hidden, and others are definitely visible.
Find them.
Note the nonlinearity: visibility is a step function.
If...
The input elevations are noisy, and
The output visibilities are very sensitive to the input,
Then...
A much quicker, less accurate, computation might produce just as good output.
A serious quantitative speed increase will translate into a qualitative improvement in what can be done.
Multilevel Game Theory
Red side places observers to cover as much terrain as possible.
Blue side, knowing the red observers, finds areas guaranteed to be hidden.
A group of observers need to radio each other.
They move.
They appear and vanish.
We want a robust solution.
Visibility is multidimensional:
Observer height, target height, radius of interest, number of test samples used, ...
Can the function be simplified?
Extend this to 3-D data structures for subsurface features.
There are technical difficulties going to 3D, such as these.
The existing terrain representations are inadequate.
A new representation will allow a formal analysis of important operations, including compression, visibility, mobility.
It will be a nonlinear representation.
It might be shallow (ignorant of the formative mechanisms) or deep. (You can model people's heights w/o knowing physiology.)
In terms of Orwell's 1984, we want a language that will make it impossible to express illegal terrain.
Mathematical approximation theory prefers to use linear functions when possible. The availability of an easily characterized set of basis functions, which can be linearly combined, is quite advantageous. Nevertheless, nonlinear approximations, such as rational functions, can be more efficient. Functions like absolute value and the step function do not have uniform polynomial approximations, but have good rational approximations.
Even for smooth functions like exponential, the best rational approximation is more efficient than the best polynomial one. The cost is in the difficulty of finding the rational approximation. The routines to find the approximation are not as available, and are slower to execute.Given the major application area of Computational and Geometric Cartography, more research into nonlinear approximations and representations is desirable.
"Galileo, Aristotle teaches us that the sun is perfect, so the sunspots you claim you're seeing with your telescope must be illusions." Why should I bother to look thru your telescope to see an illusion?
Bring serious Math and Computer Science into play
To lay a formal foundation for terrain
To find formally optimal solutions to applications including
Compression
Visibility and intervisibility
Mobility
Data conflation
Geospatial terrain elevation contains long-range, nonlinear relationships, such as drainage networks. Representations and operations, such as compression, that ignore this will be inefficient and possibly erroneous. For example, multiple correlated layers may become internally inconsistent. This paper presents various representations, and terrain operations (such as visibility), discusses criteria for a good representation, and attempts a start towards a formal mathematical foundation.
GeoSpatial Terrain: Algorithms and Representations, talk, April 2002.
Computational and Geometric Cartography, March 2001.
This is a vision statement for future research in computational and geometric cartography. This is one component of the new NSF/DARPA joint solicitation in Computational Algorithms and Representations for Geometric Objects (CARGO).
Applications of analytical cartography, Cartography and Geographic Information Systems, Jan 2000.
Several applications of analytical cartography are presented. They include terrain visibility (including visibility indices, viewsheds, and intervisibility), map overlay (including solving roundoff errors with C++ class libraries and computing polygon areas from incomplete information), mobility, and interpolation and approximation of curves and of terrain (including curves and surfaces in CAD/CAM, smoothing terrains with overdetermined systems of equations, and drainage patterns). General themes become apparent, such as simplicity, robustness, and the tradeoff between different data types. Finally several future applications are discussed, such as the lossy compression of correlated layers, and just good enough computation when high precision is not justified.
Computational Algorithms and Representations for Geometric Objects (CARGO) (FY02, FY03) solicitations, joint with NSF/MPS/DMS and DARPA/DSO,
DARPA Defense Science Office's GeoSpatial Terrain Analysis and Representations (Geo*) Future Area of Interest.
Mathematical Issues in Terrain Representation, talk at DARPA/NSF OPAAL Workshop and Final Program Review, 10 Jan 2002
Siting Observers on Terrain, paper and talk presented at the Spatial Data Handling 2002 Symposium, Ottawa, July 9, 2002.
I present an experimental study of a new algorithm that synthesizes separate programs, for fast viewshed, and for fast approximate visibility index determination, into a working testbed for quickly siting multiple observers jointly to cover terrain from a full level-1 DEM.