): almost certainly visible.
 ): probably visible.
 ): probably hidden.
 ): almost certainly hidden.
): almost certainly visible.
): probably visible.
): probably hidden.
): almost certainly hidden.
): almost certainly hidden.
): almost certainly visible.
): probably visible.
): probably hidden.
): almost certainly hidden.
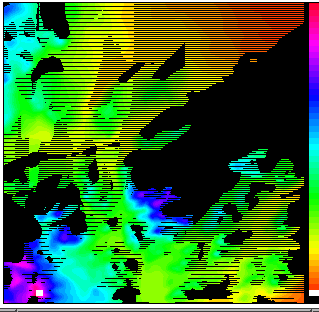
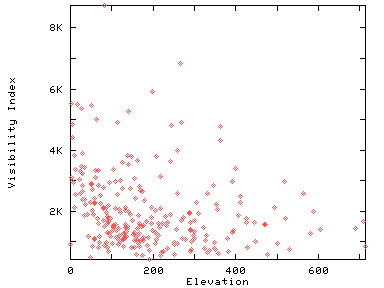
Sample viewshed output
Following are two images:
some sample terrain from South Korea, color-coded by elevation, and
the visibility indices of every point, colored similarly.
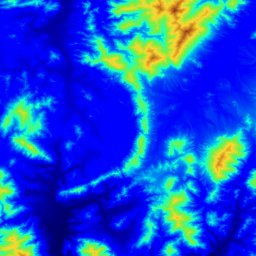
Sample Terrain; Visibility Indices
Proposal: image processing wavelet compression algorithms work well for elevation.
Yes!
Bountiful exampleMultiple observers covering a region.
Fast graphics cards?
Test the largest DEM datasets available.
Study other serendipitous questions that will arise.
Leverage from array operations tools, like Matlab?
Output sensitivity to input?
If visibility indices and viewsheds are sensitive to small input perturbations, then
Try to establish error bounds on the output.
Faster and less accurate output when input is inaccurate?
Feature recognition: feed into constrained TIN.
Investigate the general question of the proper representation of terrain elevation data.
If using TINs, use triangular splines, not just piecewise multilinear flat triangles.
Consider the idea of a conceptually deeper representation, based on the geomorphological forces that created the terrain. Devise a basis set of operators, such as uplift, downcut, etc. Deduce the operators that created the particular terrain under consideration, and store them.
Slightly differently, represent the terrain by the features that people would use to describe it. This idea is many decades old. Can we get it to work? The problem is that you can't just say that there is a hill over there, you have to specify the hill in considerable detail, which would seem to take more space than simply listing all the elevations with a grid or TIN.
The major creative force for terrestrial terrain is water erosion. This does not apply to the moon, Venus, and, to the same extent, to Mars. Therefore those surfaces might be statistically different. What impact, if any, would this have on the speed and output distribution of our algorithms and data structures?
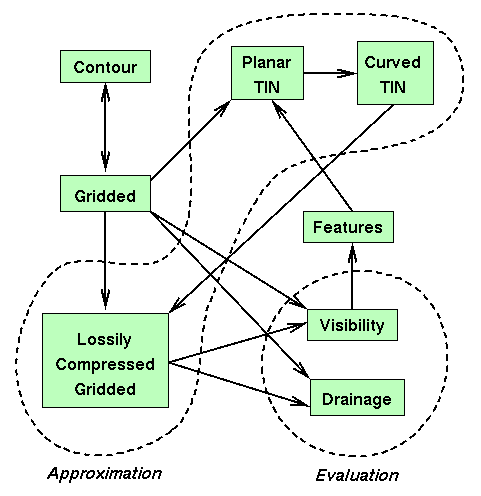
This flow chart shows how the various parts can fit together.