I present an experimental study of a new algorithm that synthesizes separate programs, for fast viewshed, and for fast approximate visibility index determination, into a working testbed for quickly siting multiple observers jointly to cover terrain from a full level-1 DEM.
Context
Several year project in studying terrain elevations. Previous results:
Triangulated Irregular Network I can TIN all points of a level-1 DEM in about a minute on this laptop.
Lossless and lossy compression of gridded elevation databases.
Interpolation from contours to grid.
Observer Siting
PhDs generated:
-
Clark K. Ray, Representing Visibility for Siting Problems, 1994. (now at US Military Academy, West Point)
-
Michael B Gousie, Contours to Digital Elevation Models: Grid-based Surface Reconstruction Methods, 1998. (Wheaton College)
Helio Pedrini, An Adaptive Method for Terrain Surface Approximation Based on Triangular Meshes , 2000. (Universidade Federale do Paraná)
Masters graduates:
- John Childs, (Interpolating Contour Lines Using an Overdetermined Laplacian PDE), 2003.
-
Cheok Hee, The Cross Area Problem in Cartography, 1992.
-
James TenBrink, The Maintenance of Voronoi Diagrams Imposed Upon Moving Point Sets, 1991.
-
Venkateshkumar Sivaswami, Point Inclusion Testing in Polygons and Point Location in Planar Graphs Using the Uniform Grid Technique,
1990. -
David Sun, Implementation of a Fast Map Overlay Program in C, 1989.
-
Colin Verrilli, One Source Voronoi Diagrams with Barriers - A Computer Implementation, 1984.
-
Steve Wong, A Tactical Model Simulation for 3-Dimensional Look-Alike Sonar Trainers, 1981.
-
Steve Lord, Upgrading of the U.S.M.A. Wargame, 1979.
| 
|
Themes
Efficiency, efficiency, efficiency. "Quantity has a quality all its own."
Computing power is not necessarily growing as fast as the data size. (cf PDA)
If we can do simply things quickly, then we can probably do more complicated things, albeit slowly.
Use large, not toy datasets.
Simplify the problem. Ignore refraction, vegetation, earth's curvature, etc. We have to start somewhere. These can be added.
Unknowns
- Beware the unknown unknowns. Is the answer significant?

The visibility of one half of the points in uncertain!
Applications
- Cell phone towers
- Radio relays on the moon (no ionosphere or stable orbits), and Mars (weak ionosphere)
- Tourism attractions.
- Conversely, visual nuisances to be hidden from the tourists (forest clearcuts, park garbage dumps, private vacation homes).
- Military observers, concealment from observers, route planning, route updating as the observers vanish.
- Maybe connectivity of visible (or hidden) region is important.
Components of our System
- VIX: Find approx visibility index of each point in cell. (Use sampling.)
- FINDMAX: Select a sample set of points that have hi vix and also are spaced out.
- VIEWSHED: Find the viewshed of each sample point. (Run lines of sight out.)
- SITE: Select a subset of those viewsheds to cover the cell as well as possible.
Details - Definitions
- Terrain means elevation. Ignore surface features for now.
- Use a grid (matrix) of elevations (in this talk; I implemented TINs in 1973).
- Visibility Index: How much can a particular observer see?
- Viewshed: What, specifically, can a particular observer see?
- Multiple Observer Siting
Given some terrain...
Choose the smallest set of observers that will cover as much terrain as possible.
VIX - Find Approx Visibility Index of Each Point
- 1,442,401 points (aka observers): speed is essential.
- Choose a parameter, T, say T=10.
- Other parameters: observer ht, target ht, radius of interest.
- For each observer, select T targets at random. Run a line of sight to see if the target is visible.
- Number of targets visible by that observer: its approx visibility index.
- Program coded carefully. Each LOS test averages 8 microseconds on a 600 MHz Pentium.
Findmax - Select Observer Subset
- From the 1442401 points, select the best 1000.
- Best: highest visibility index and also well spaced (to correct for clusters of good points).
VIEWSHED
To determine which points within R, the radius of interest of the observer, are visible.
- Define a 2R by 2R square about the observer.
- Iterate around its perimeter.
- For each point on the perimeter, run a line of sight from the observer to it.
- See which points on that LOS are visible.
- The execution time per observer is proportional to R2.
- If we had run LOSs to each point, instead of to each point on the perimeter, the time would have been much worse: R3.
Site - Find a good set of observers
We have a set of possible observers, with their viewsheds (stored as bitmaps). Now, select a subset that covers the terrain cell.
- This is a greedy algorithm.
- As we progress, we know the set of observers chosen so far, and C, the region that they cumulatively see (stored as a bitmap).
- To add another observer to the set:
- Temporarily unite each remaining observer's viewshed with C, and calculate its area.
- Pick the observer that results in the largest resulting area.
- However, remember how much new area each possible observer would have added. In the next round, perhaps do not even consider this observer. This saves time.
- Update everything.
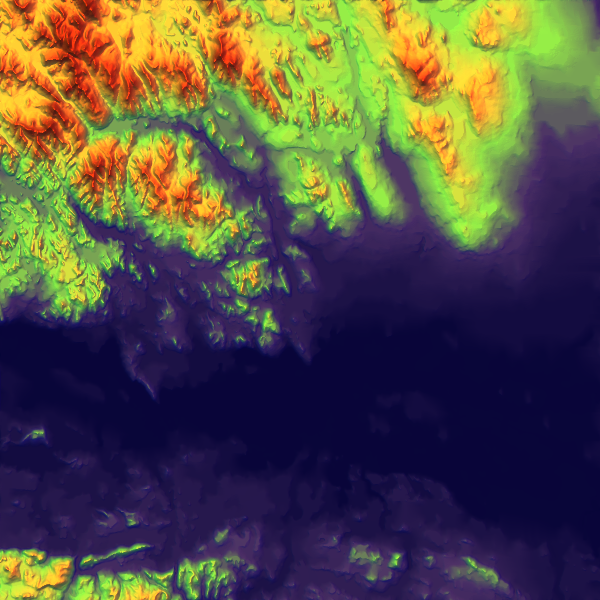
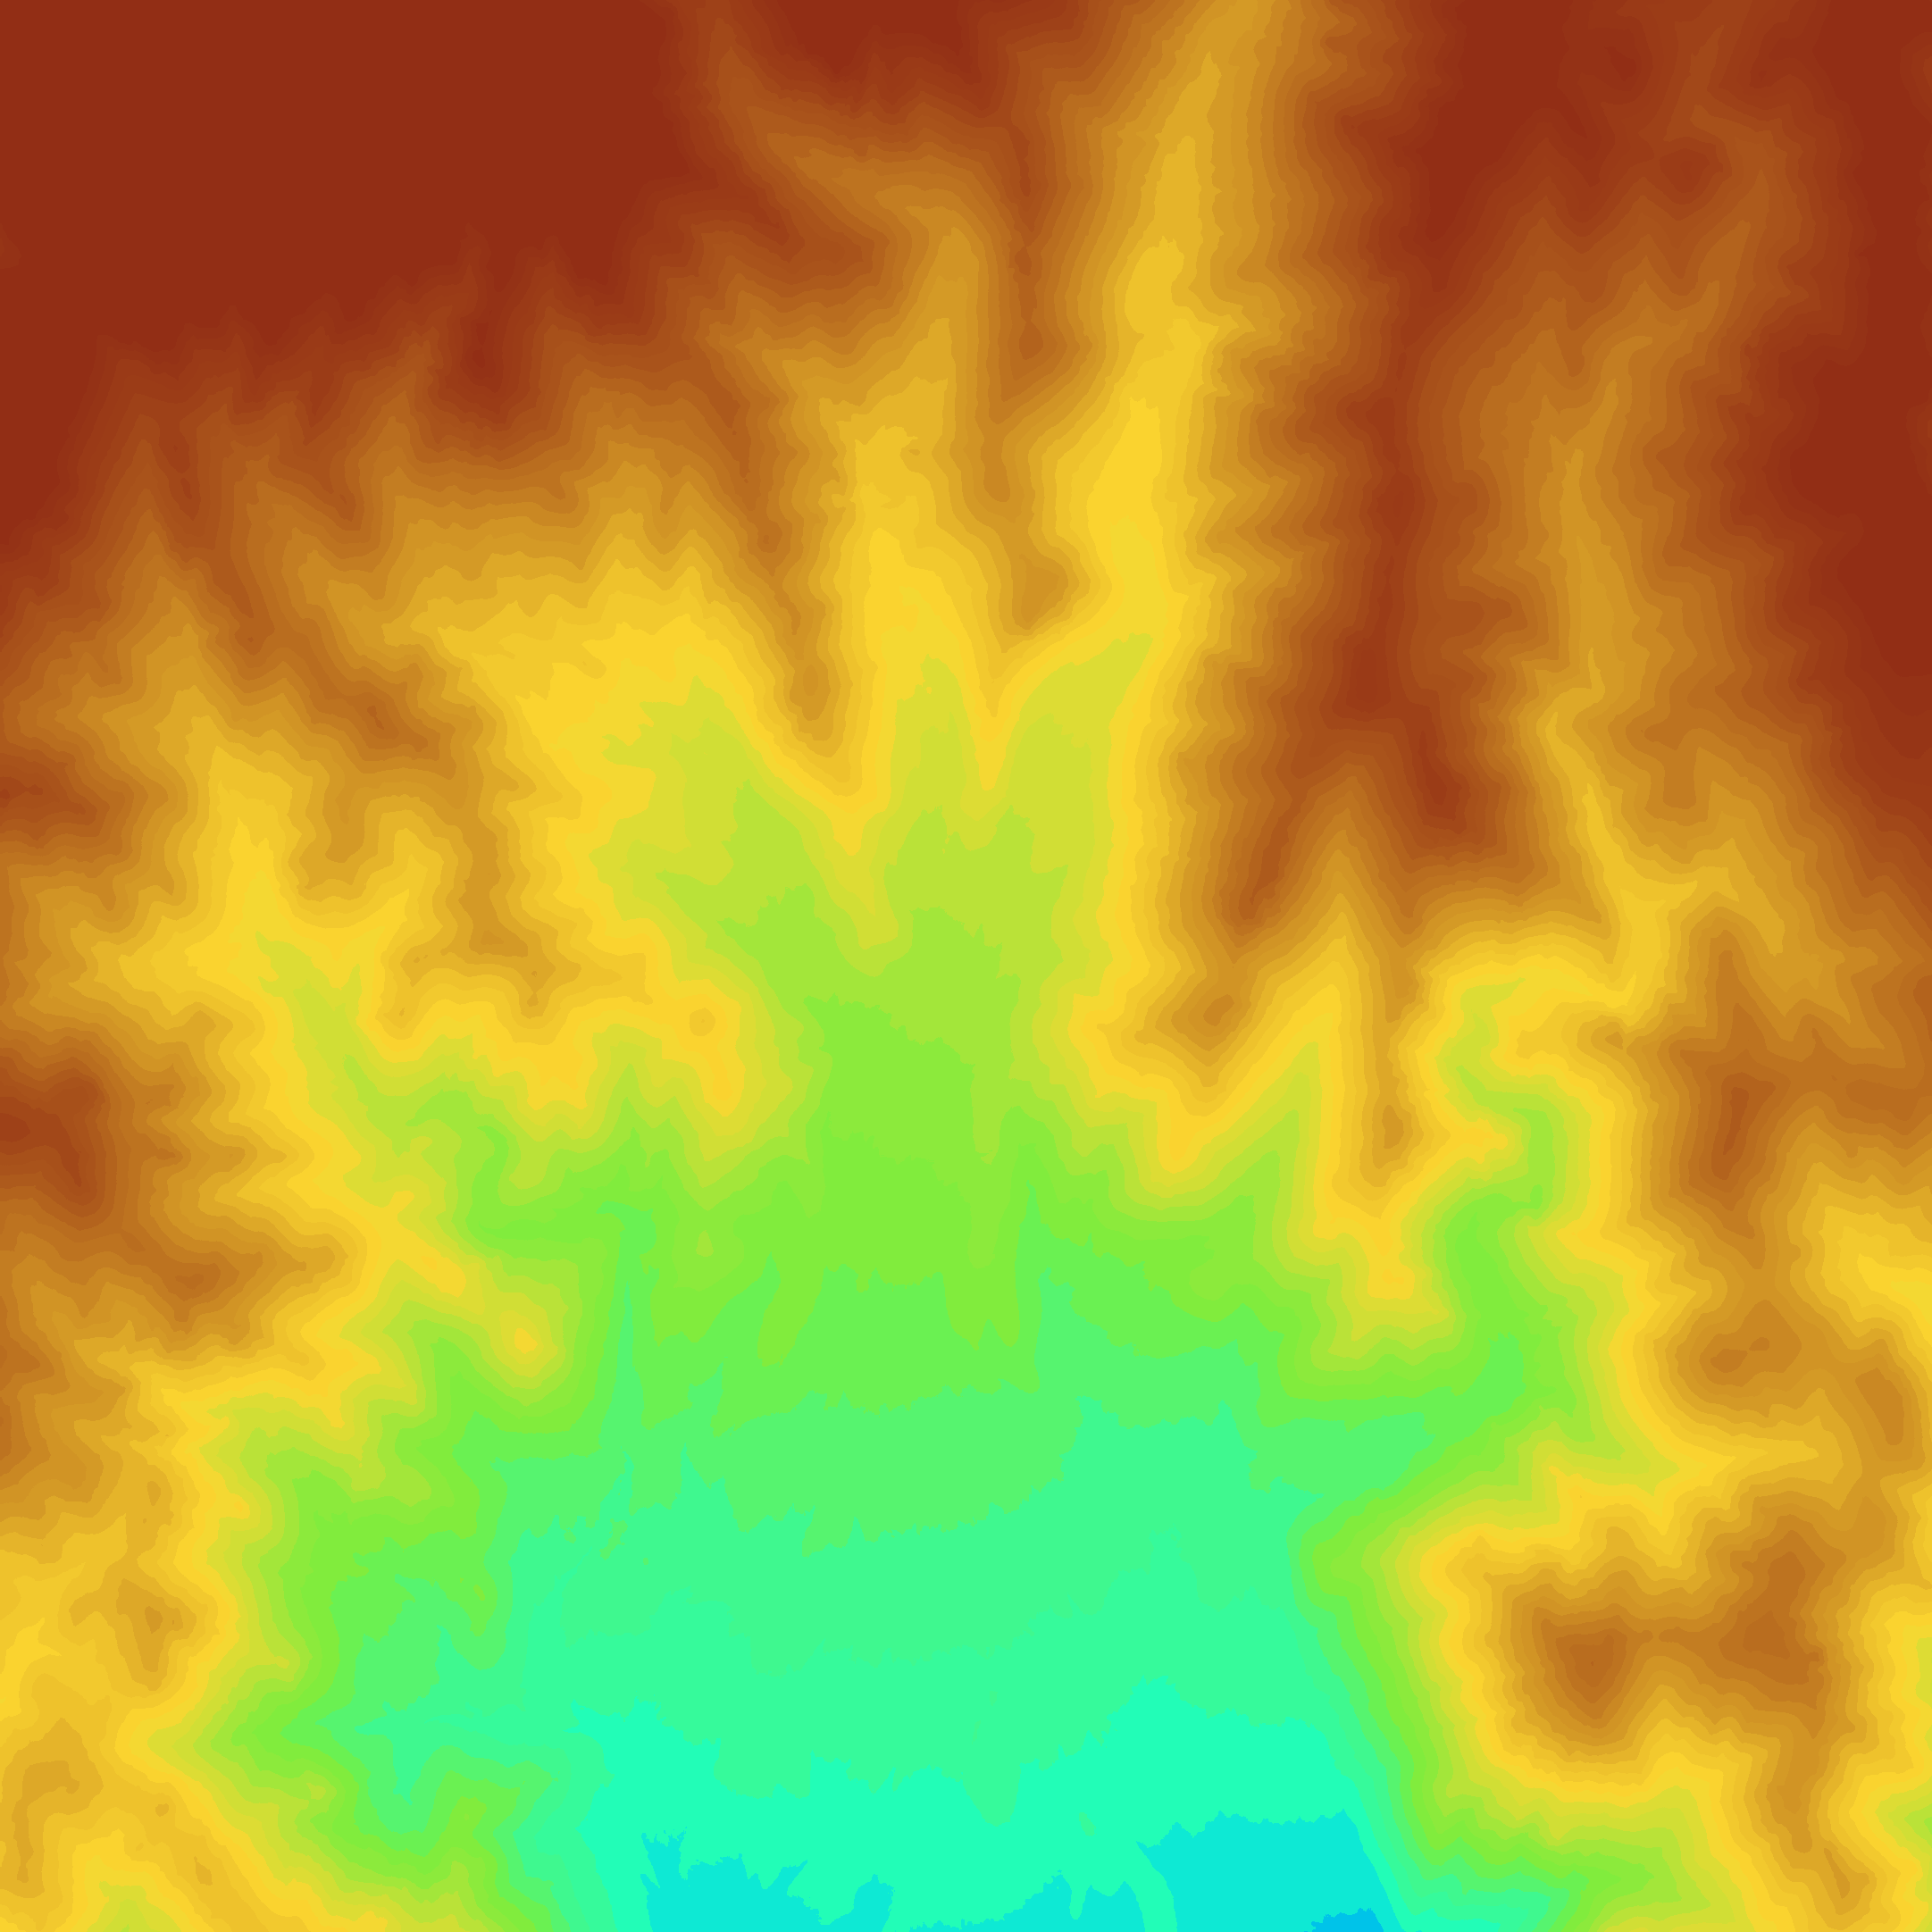
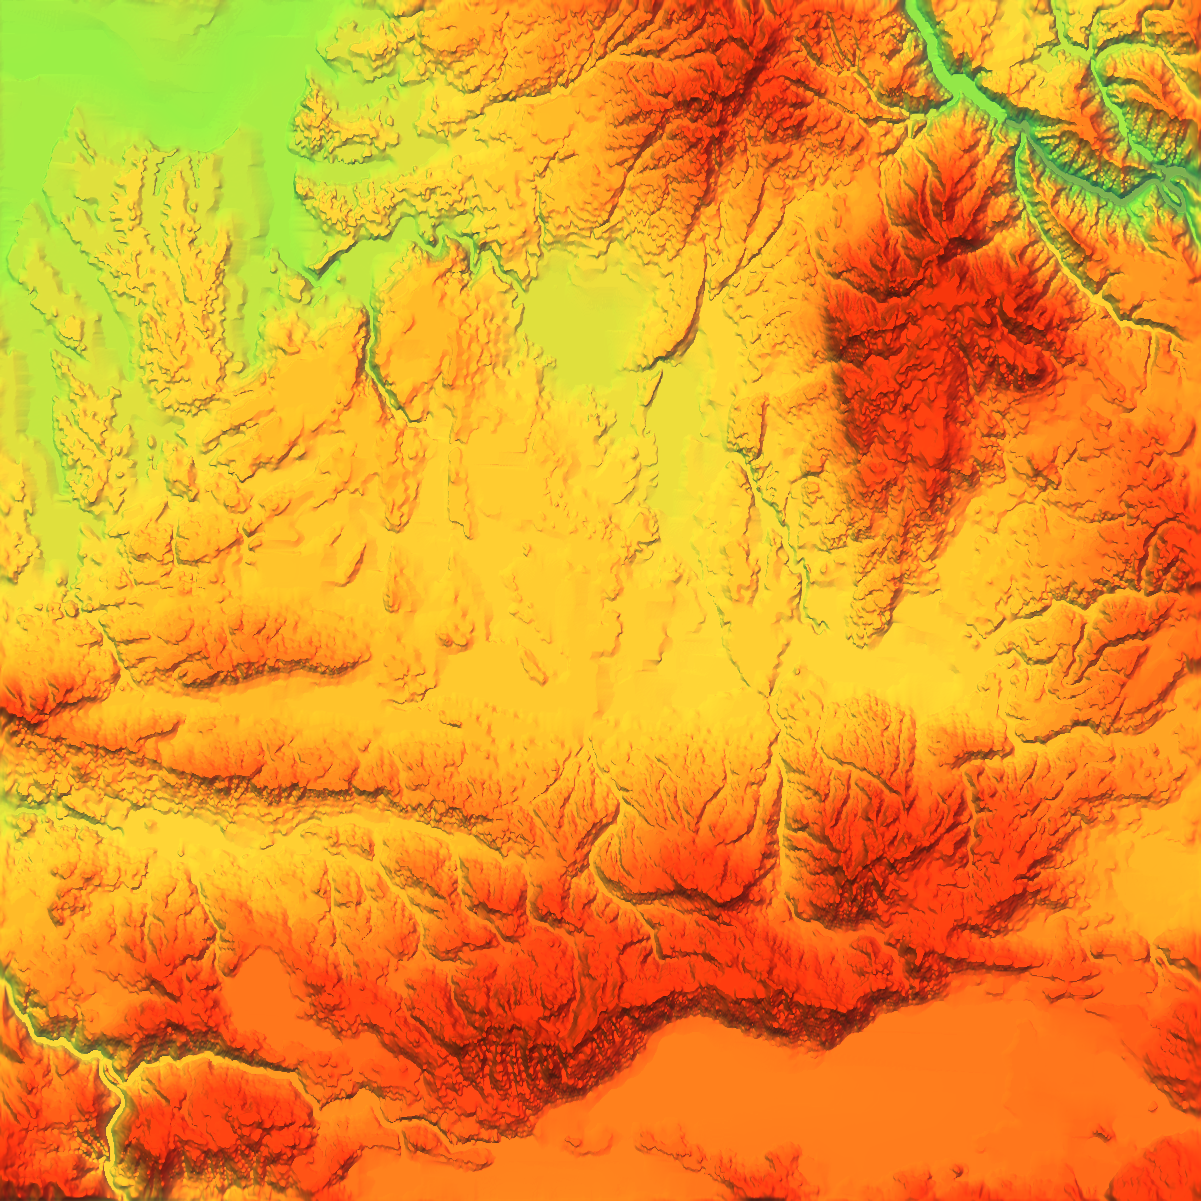
Visibility Indices
|

|
| Terrain | Visibility (blue= lo; brown= hi) |
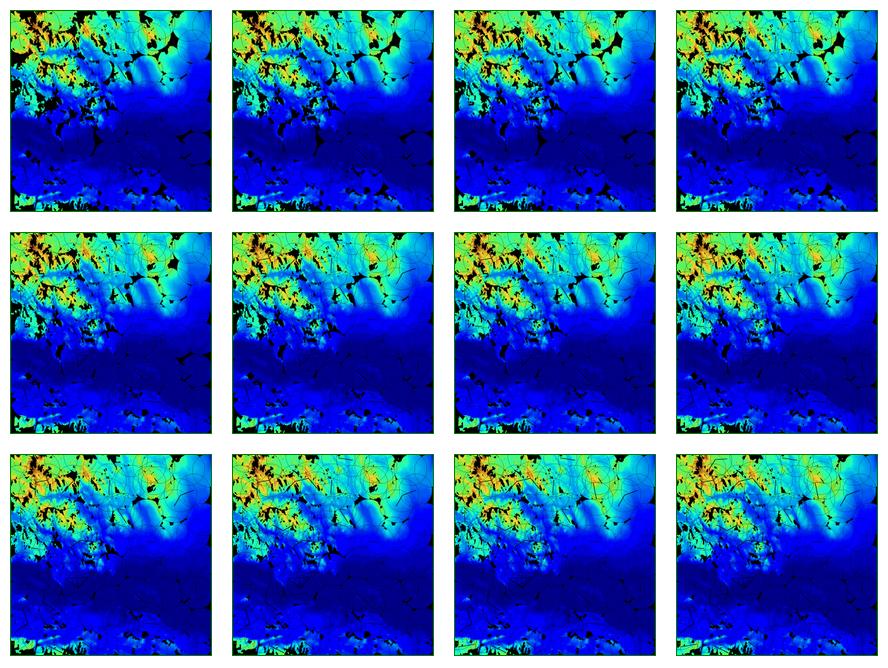
Sample Viewsheds
Observe the level of detail. Compare this to the viewsheds as determined by other systems.
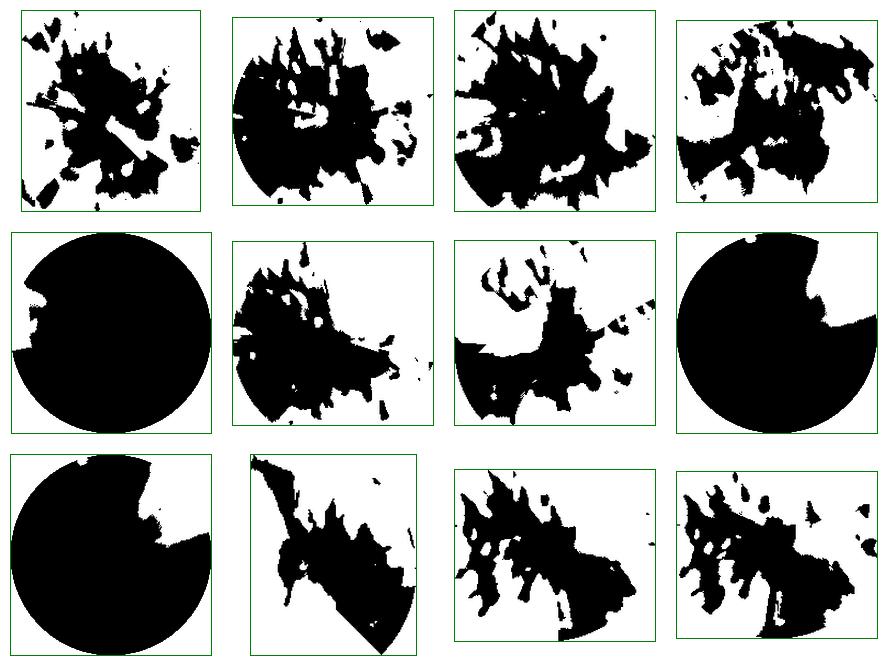
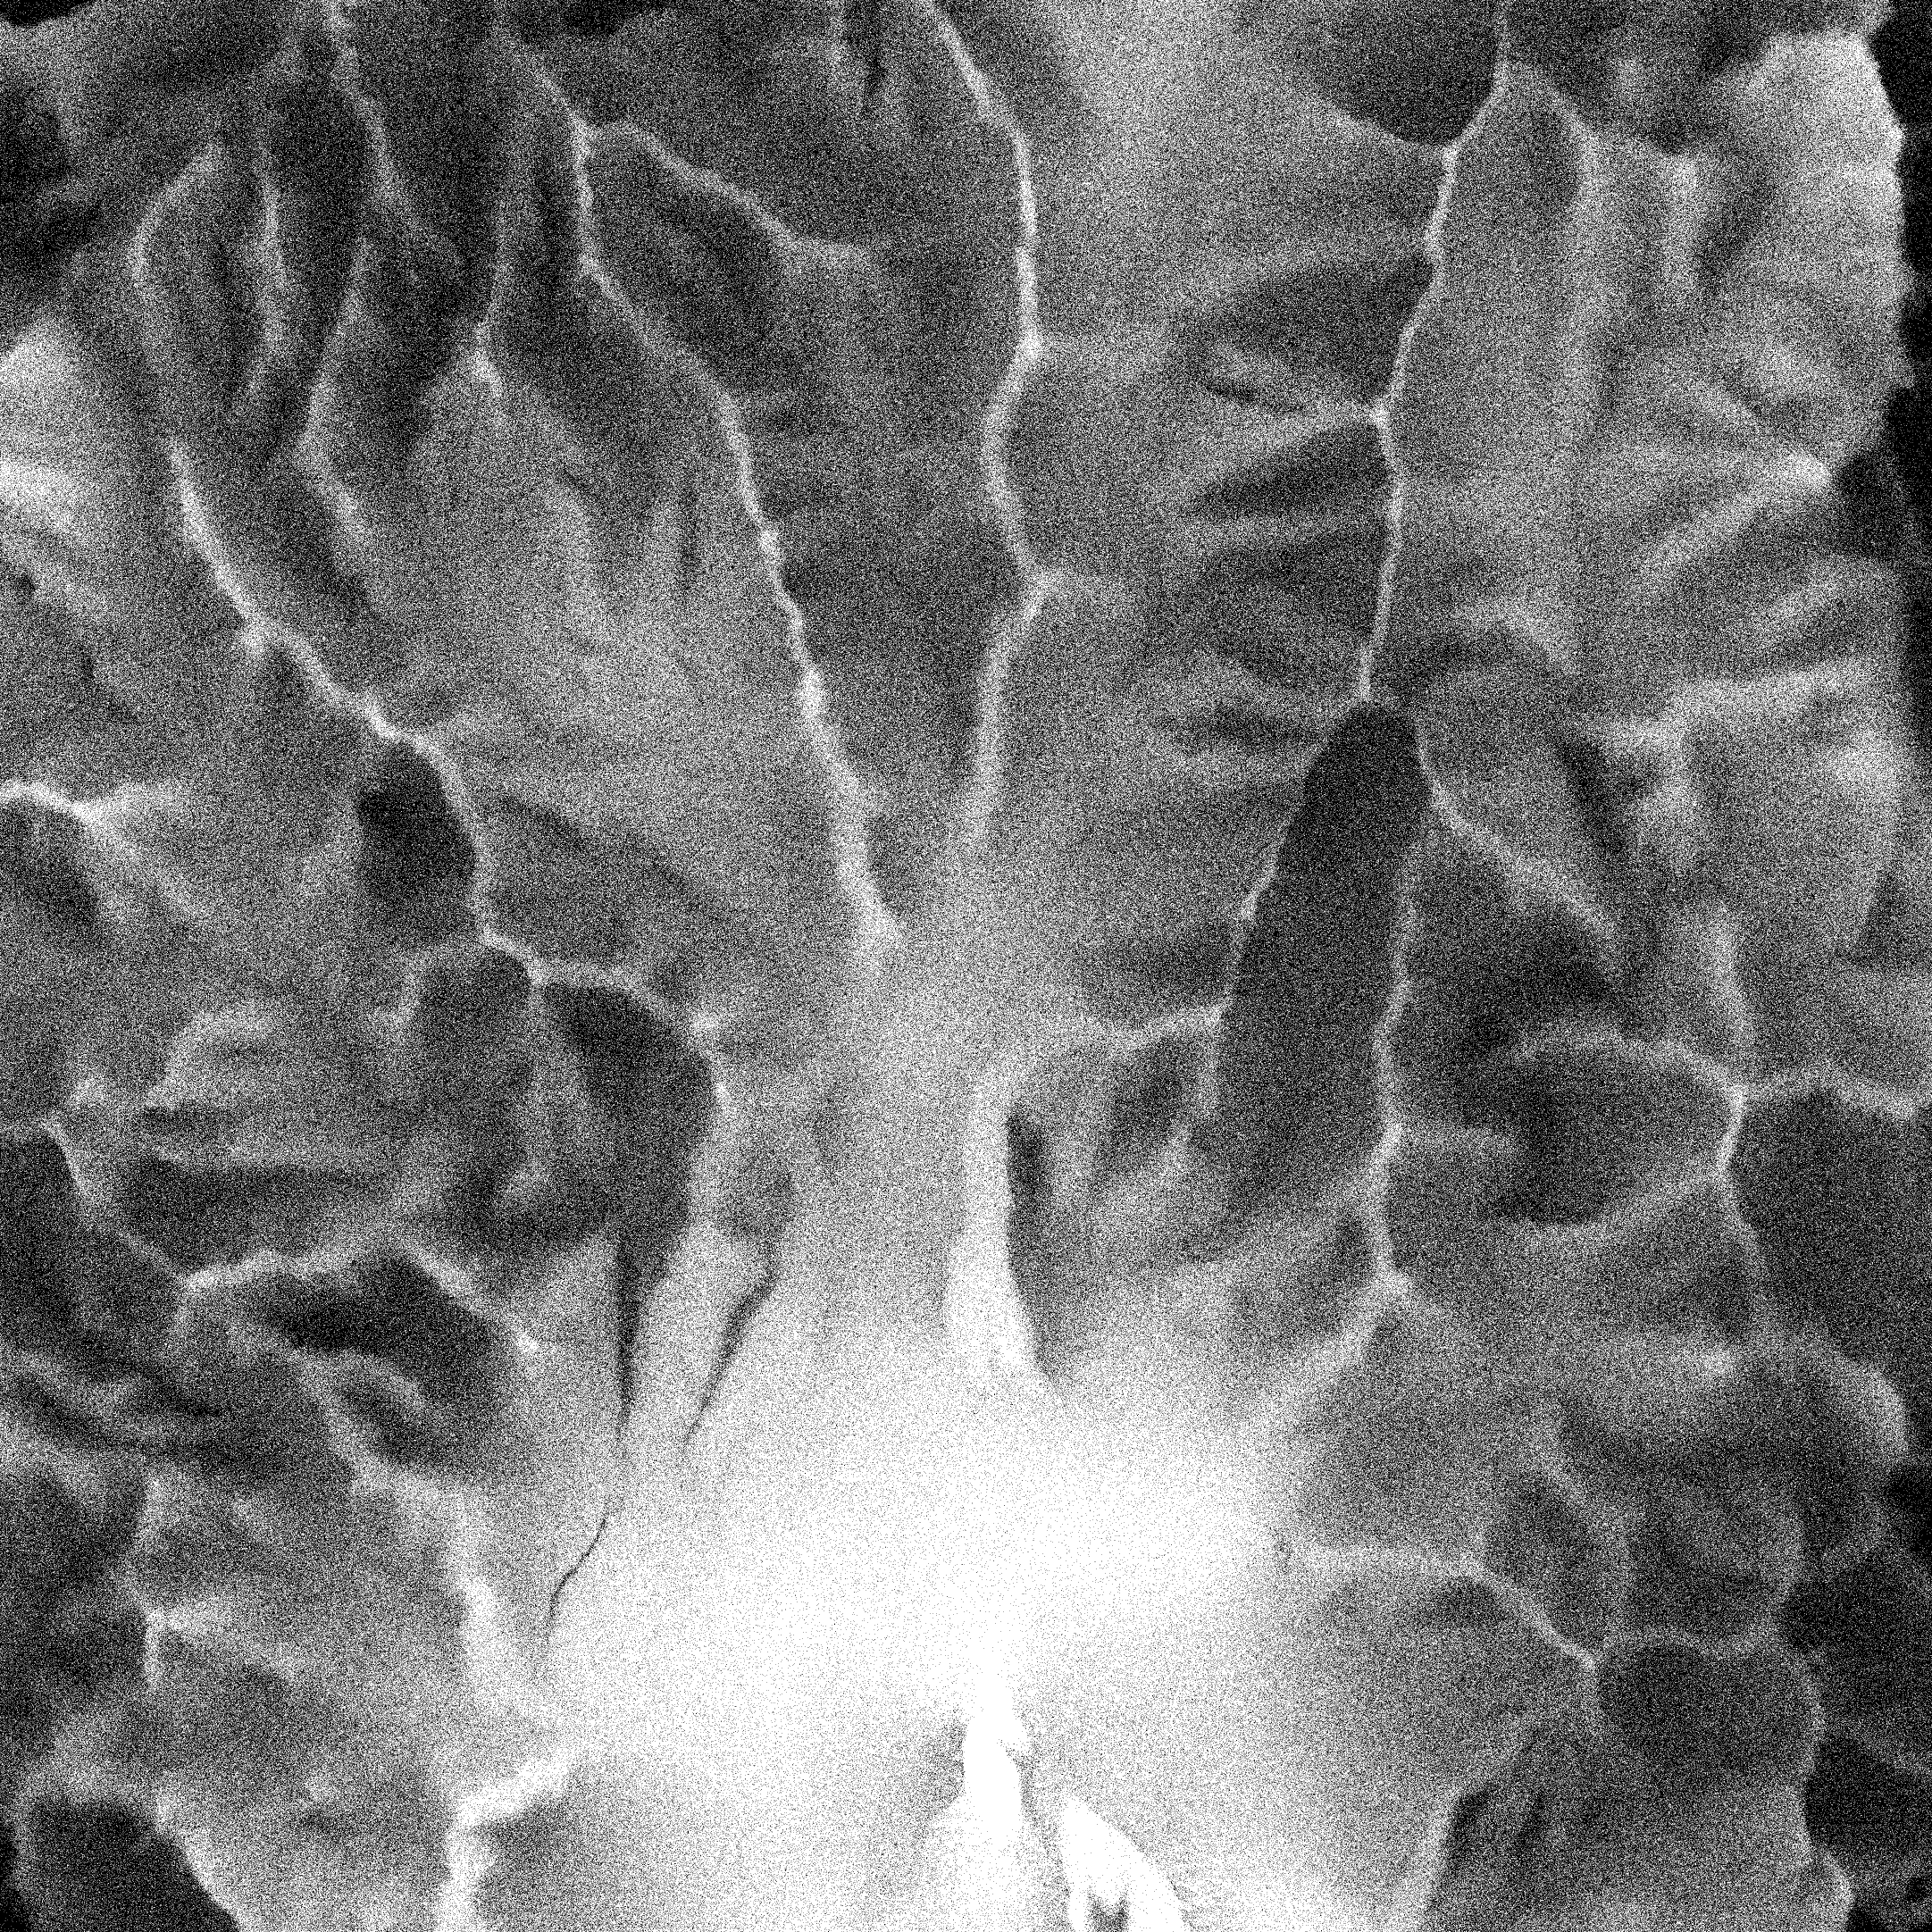
Detail in a viewshed
Since the montage images are scaled down, here is one viewshed blown up, to show the detail.

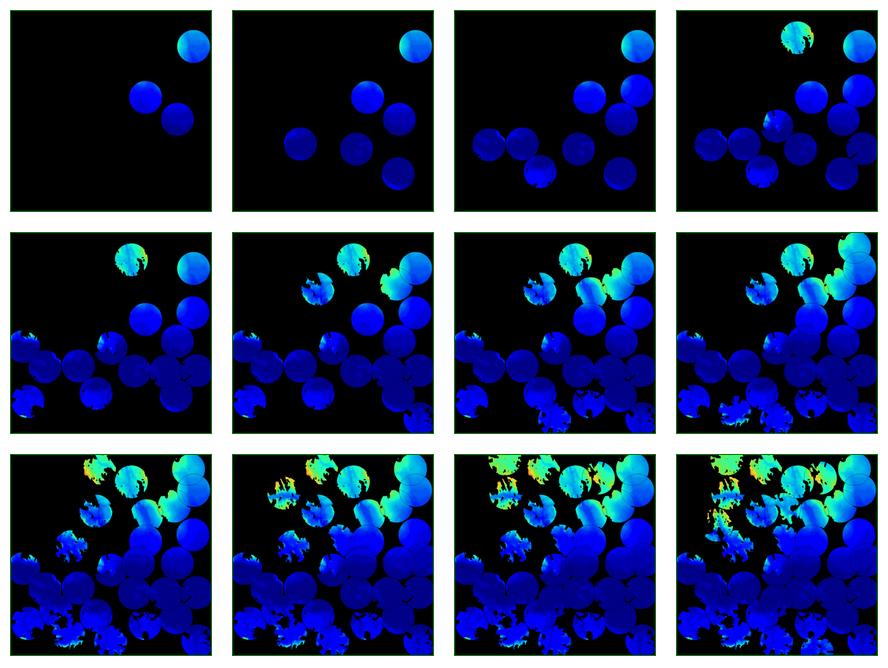
Siting Multiple Observers with Intervisibility
- Use the above tools to find a good set of observers whose own pairwise visibility forms a connected graph.
- Assume a limited range
- This dataset is the USGS Lake Champlain West level-1 DEM.
Successive New Observers


Sample Cumulative Viewshed
One cumulative viewshed at its original resolution.

Relaxing the Intervisibility Constraint
Fewer observers are necessary to cover the same area.

Surprising Observation
Except at the start, the most visible observers are not added earlier.

Area of Last Inserted Viewshed (*30),
and
Cumulative Visible Area,
as Observers are Inserted
Very Large ROI, with Intervis
Lake Champlain West, ROI=2000, Ht=10, 3 targets per potential observer.
After 6 observers have been inserted.

Pal1met Experiments
Since our SW uses square datasets, cut out 2163x2163 subset.
Quickly estimated visibility indices:
| 
|
| Elevations | Visibility Indices |
Adding Observers

Effect of Uncertainty on Cumulative Viewshed
- Data has uncertainty.
- Algorithm has uncertainty.
- How badly does this hurt us?
- Formalize this carefully.
Let C be the cumulative viewshed that can be seen by O, the optimal set of observers chosen using perfect data and algorithms. However, in the real world, because of the algorithm and data approximations, our program has selected O', a suboptimal set of observers. The important question is, How much worse is O' than O? That is, let C' be the cumulative viewshed of O'. How much smaller is C' than C?
Altho O' has been computed using the approximate data and algorithms, the proper approach is to compute C' from O' using the best available data and algorithms.
Experiments by Christian Vogt on USGS Baker E Cell
My current masters student. He uses Baker East:
Later we'll see if these observations generalize.
Compare Observer Selection Strategies
Start picking observers randomly within cells is about the fastest method. How good is it? Ans: surprisingly good
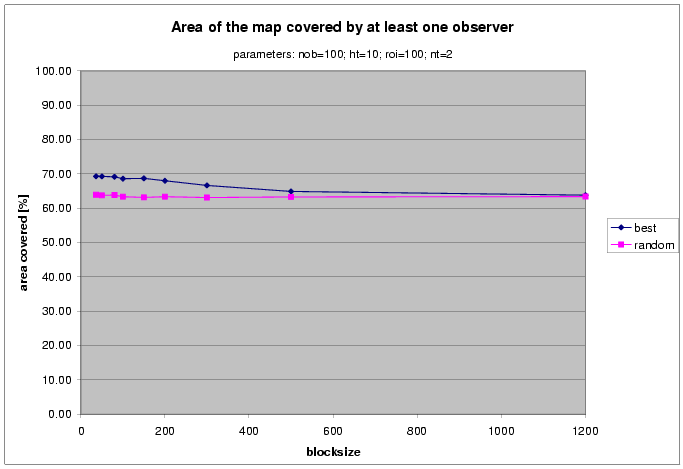
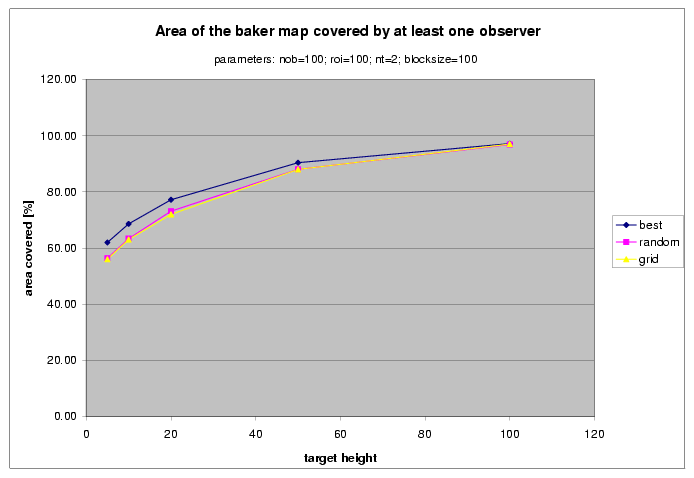
Effect of Higher Observers
For any height, random observers is not much worse than best observers.
Number of Observers for 75% Coverage
at different heights, for random vs. best observers

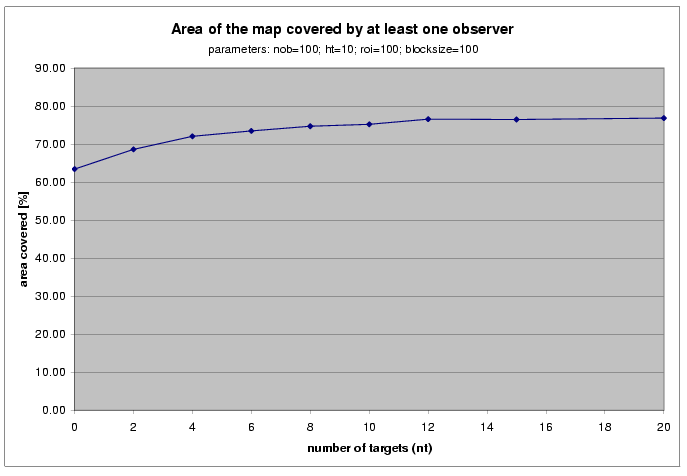
Effect of More Observers
at fixed height for random vs best observers.
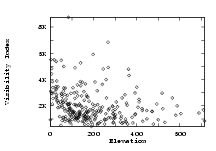
Effect of More Random Targets per Observer
The visibility index of each potential observer is computed by counting how many of T random targets it can see. A larger T takes more time but leads to a better selection of the best observers.
Lower Res Viewsheds
Vogt's current effort:- Computing hi-res viewsheds of many potential observers is the slow.
- Since random observers are so good,
- Start with lo-res viewsheds for most potential observers.
Future Possible Extensions
- Uncertainty determination, and sensitivity analysis to errors in the input and algorithm.
- Planning a path between two points, either to maximize or to minimize the visibility.
- Determination of the integrated visibility, summed over the observer's traversal of that path.
- Connectivity analysis, since many small and separate hidden areas may be less serious than one large one.
Future: What do we really know about visibility?
- Small changes in the input cause large changes in the input.
- Some viewshed images are partly (mostly?) fiction.
- However certain regions are definitely hidden, and others are definitely visible.
- Find them.
- Note the nonlinearity: visibility is a step function.
Just good enough computation
If...
- The input elevations are noisy, and
- The output visibilities are very sensitive to the input,
Then...
- A much quicker, less accurate, computation might produce just as good output.
- A serious quantitative speed increase will translate into a qualitative improvement in what can be done.
Multilevel Game Theory
- Red side places observers to cover as much terrain as possible.
- Blue side, knowing the red observers, finds areas guaranteed to be hidden.
Data Mining
- Visibility is multidimensional:
- Observer height, target height, radius of interest, number of test samples used, ...
- How visibility index depends on height:
Can the function be simplified?
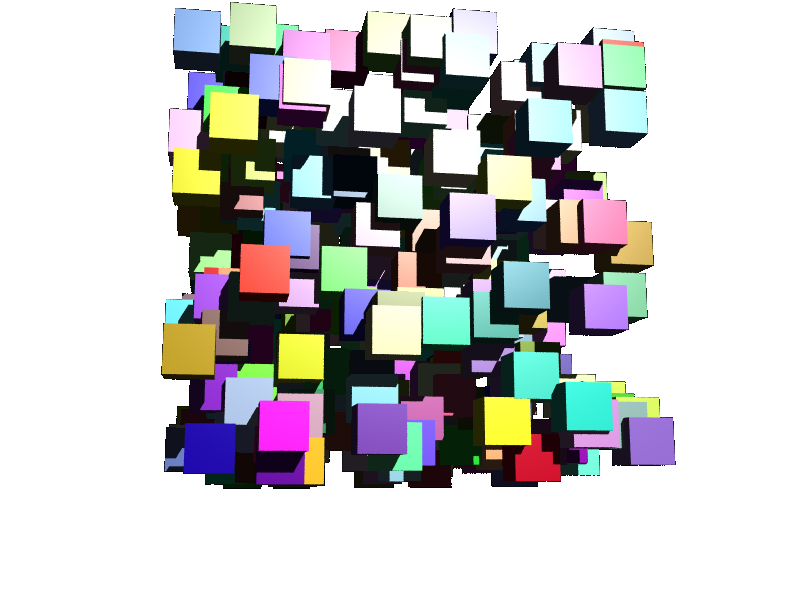
Related 3D Geometric Work
Volumes of union of many polyhedra.
This combines new geometry formulae with efficient data structures and algorithms. It demonsrates the methodology, which is applicable to other problems.
Test: 20,000,000 cubes.
How an Idea Progresses
- Form a new idea.
- Preliminarily implement and test on one toy dataset: proof of principle. Optimize programmer time. Ignore data structure size and algorithm speed.
- Rethink everything and design efficient algorithms and data structures.
- Test on realistic datasets.
- Observe unexpected phenomena.
- From this base, form new ideas.
Acknowledgements
Productivity was greatly helped by:
- Linux
- LaTeX
- xemacs
- xv
- g++
National Science Foundation
How it all fits together
Example Videos
Here are some videos illustrating points mentioned here.
overlay-intervis.mpg: Incrementally adding observers, with intervisibility..
overlay-nointervis.mpg: Incrementally adding observers, without intervisibility..
cube-inc.mpg:
Many overlapping cubes, for computing union volume, area and edge length
Email: wrfATecse.rpi.edu
http://wrfranklin.org/
☎ +1 (518) 276-6077; Fax: 6261
ECSE Dept., 6026 JEC, Rensselaer Polytechnic Inst, Troy NY, 12180 USA
(GPG and PGP keys available)
Copyright © 1994-2004, Wm. Randolph Franklin. You may use my material for non-profit research and education, provided that you credit me, and link back to my home page.