Consider the elevation throughout a region of terrain, together with an observer and target(s). Can the observer see the target? What targets can the observer see? Where are the best places for the observer?
There are many applications for terrain visibility.
Siting of military observers so as to overlook as much terrain as possible.
Siting of people who wish to remain hidden from the above observers.
Cellphone and other radio transmitter siting.
Siting of visual nuisances like forest clearcuts and open pit mines away from the tourists' gaze.
We describe some existing programs to answer these questions, and then propose future work. All these programs are very efficient on large databases.
The terrain universe is defined by a square array of NxN elevations.
The observer is (x,y,h), a point in the terrain, plus a height above the surface, for the usual case that the observer is above the terrain.
The target is also a point in the terrain. Sometimes a height above the surface may be specified. At other times, the programs report the minimum height above the surface at which a target over that point becomes visible by the specified observer.
Our existing programs include the following.
Program viewshed finds the viewshed, or visibility polygon, or the set of points in the terrain that can be seen by a given observer who may be a specified height above the surface. Although a viewshed is defined only for some target height, Viewshed also computes the minimum visible elevation, or the lowest height at the point that is visible by the observer, of every point in the terrain.
Viewshed operates by working out from the observer in square rings. The iteration invariant, which is known for each point of one ring before the next ring is computed is the minimum elevation above that point that is visible.
If the point is visible, then that minimum is zero.
Note that these minimum visible elevations for a ring mostly encapsulate the relevant terrain elevation information for points inside the ring. Once a ring is computed the interior points will not be considered again.
To compute the minimum visible elevation for a target point in the next ring out, a line of sight (LOS) is drawn from the observer to the target point. This LOS will pass between two adjacent points in the adjacent inside ring. The LOS is made to pass between these points at the minimum visible elevation. Then, its elevation at the target becomes the minimum visible elevation of the target.
Since it is impossible for one elevation post to completely represent the elevation throughout a square of terrain, and impossible for two posts to represent the elevation in the whole space between them, where the LOS is passing, some approximation is required. This can be biased as desired. The LOS may be made to pass between the two adjacent points at an elevation linearly interpolated from its relative distance between them, or at the greater of their two elevations, or at the lesser elevation. The first method (interpolation) is perhaps the most accurate, although it has an obscure uncertainty that grows with the ring size. The second (max) biases the minimum visible elevations on the high side, while the third (min) biases the minimum visible elevations in the low direction.
This means that for a given target elevation, we can classify each point in the terrain thus:
target points that are almost certainly hidden, since the minimum visible elevation calculated with the min approximation is above the target elevation.
target points that are probably hidden since the target elevation is below the interpolated minimum visible elevation.
target points that are probably visible since the target elevation is above the interpolated minimum visible elevation.
target points that are almost certainly visible since the target elevation is above the minimum visible elevation calculated with the max approximation.
Viewshed is extremely fast. On a 75 MHz Pentium, recomputing the viewshed for a 300x300 terrain takes under 0.5 CPU second. Indeed, on some platforms, the visibility computation is faster than the frame buffer updating. The asymptotic execution time is linear in the number of terrain points, or theta(N2), which is quite favorable compared to the exact theoretical algorithms. Also, an exact computation is not justified given the inexact input. Our philosophy is good enough accuracy.
Below is a sample of viewshed's operating on a 300x300 piece of the Lake Champlain West level-1 USGS DEM. Elevation is indicated by color. There is a color scale along the right side. The observer was located at the highest point in the terrain, and about 15 meters above ground level. The target was assumed to be about 15 meters up, the visibility was calculated 3 ways as described above, in about 1 CPU second total on the 75MHz Pentium, and the terrain was shaded accordingly:
 ): almost certainly visible.
 ): probably visible.
 ): probably hidden.
 ): almost certainly hidden.

Sample viewshed output
Vix finds the visibility index, or the area of the viewshed, of every point in the terrain.
We do not find each point's explicit viewshed, but rather use sampling techniques to estimate its area. For each observer, perhaps 32 rays are fired out at equally spaced angles towards the edge of the terrain. Along each ray, a subset of the points are selected, and a one-dimensional line-of-sight algorithm is executed on them, to compute the number of visible points, in time linear in the number of points tested. The visibility index of the observer is the fraction of tested points that are visible.
Vix then repeats this process for all N2 possible observers.
Following are two images:
some sample terrain from South Korea, color-coded by elevation, and
the visibility indices of every point, colored similarly.
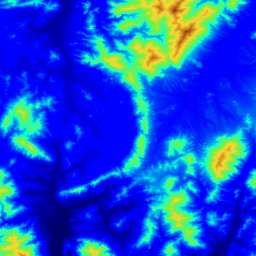

Sample Terrain; Visibility Indices
Some notable points are these:
The north-south ridge in the center is sharpened.
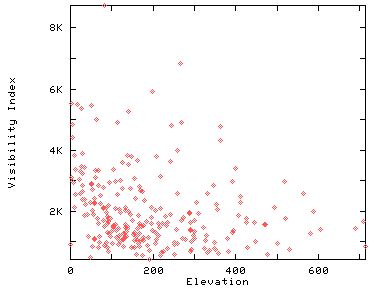
The lowest region is the water at the south near the west, but its visibility indices are surprisingly high.
In contrast, the high mountainous region in the north center is not so visible.
There is often little correlation between elevation and visibility index, as seen in this scatterplot of the above data (whose correlation coefficient is very slightly negative).
Note that our algorithm is performing a classic statistical sampling and estimation. We estimate the fraction of all the points that are visible by testing a subset. Assuming that our sampling is uncorrelated with the points' visibility, computing the standard deviation in our estimate is easy. A check is also possible by dividing the rays alternately into two groups, computing the visibility index separately for each group, and measuring the significance of the difference in the means with a T-test. Vix could be extended to use this adaptively so to fire only the minumum necessary number of rays.
Given the visibility index of each point, the identity of the most visible points is trival. In addition, if only the locations of the most visible points are required, less accuracy in the visiblity index computation may be appropriate.
Programs viewshed and vix may be used to find a set of observers that jointly can see every point as follows.
This process can be refined as follows.
When selecting Oi for i>1, instead of choosing the most visible remaining point, test the several most visible remaining points, and choose the one that can see the most remaining points. This corrects for points whose viewsheds largely overlap each other.
(That problem is less serious than one might suppose. Indeed a very visible point tends to dominate its neighbors, so that they are not very visible.)
The programs described here use gridded elevation data. Some others use a Triangulated Irregular Network (TIN). Although a TIN requires fewer triangles than a grid requires points, each triangle must know its neighbors, which adds to the data size (if this is stored), or to the time (if this is computed from the points assuming a Delauney triangulation). The algorithms are also more complex, and most TIN programs have been demonstrated only on toy datasets.
We also use algorithms specialized to the visibility problem, instead of general techniques such as neural nets or simulated annealing, since, when specialized solutions are known, they can be much faster.
Use a better algorithm in viewshed, to remove that obscure inaccuracy. We know how to do this, but haven't had the time yet.
Implement the multiple-covering-observer idea described above.
Study whether fast graphics cards can be employed.
Transfer the programs to current hardware, and optimize for that. The goal is to make viewshed operate in real time as the user pans over the terrain and changes the observer and target heights. Note that it's almost there already.
Test the largest DEM datasets abvailable.
Study other serendipitous questions that will arise.
Can any of these algorithms be cast into the form of array operations, so that tools such as Matlab can be used?
Investigate the sensitivity to input changes, perhaps by randomly perturbing the elevation, recomputing visibility, and repeating many times.
If visibility indices and viewsheds are sensitive to small input perturbations, then
Try to establish error bounds on the output.
Investigate whether the algorithms can be be faster and less accurate, so that the output is only as accurate as is justified.
The highly visible points seem to capture features of the terrain, such as ridgelines.
Test this idea on more data.
If it holds, then use this somehow, say in a constrained TIN. One problem with a TIN is that features tend not to be especially picked, and so the resulting triangles cut across and obliterate features. One accepted solution is to force important points and edges into the triangulation, if we know what they are.
Investigate the general question of the proper representation of terrain elevation data. Is a TIN better than a grid? I have implemented both methods, and was perhaps the first person in cartography to implement a TIN, back in 1973, following the suggestion of Tom Poiker and David Douglas. I have also implemented gridded data structures and algorithms, e.g., for hidden surface removal in computer graphics, since about 1975. Mike Gousie, my latest PhD student, and I studied interpolating from a contour data structure to a grid.
If using TINs, use triangular splines, not just piecewise multilinear flat triangles. We don't claim to have invented this classic idea, we may find some new twists. Multivariate triangular splines are not so common as cartesian products of single-variate splines because of technical difficulties. Nevertheless, they are conceptually better than the cartesian product splines. They also look a little like multivariate wavelets.
Consider the idea of a conceptually deeper representation, based on the geomorphological forces that created the terrain. Devise a basis set of operators, such as uplift, downcut, etc. Deduce the operators that created the particular terrain under consideration, and store them.
Slightly differently, represent the terrain by the features that people would use to describe it. This idea is many decades old. Can we get it to work? The problem is that you can't just say that there is a hill over there, you have to specify the hill in considerable detail, which would seem to take more space than simply listing all the elevations with a grid or TIN.
The major creative force for terrestrial terrain is water erosion. This does not apply to the moon, Venus, and, to the same extent, to Mars. Therefore those surfaces might be statistically different. What impact, if any, would this have on the speed and output distribution of our algorithms and data structures?
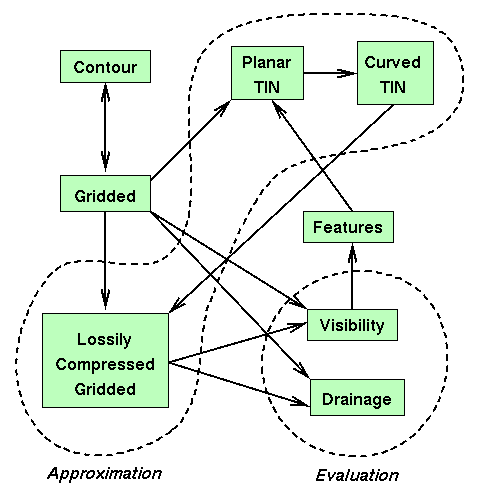
This flow chart shows how the various parts can fit together.